How to drop unused level of factor variable in R
Introduction
When working with factor variables in R, you may encounter situations where certain factor levels are no longer present in your data after filtering or subsetting operations. These unused levels can cause issues in statistical analyses and visualizations. Dropping unused factor levels ensures your data accurately represents only the categories that are actually present.
Getting Started
library(tidyverse)
library(palmerpenguins)
Example 1: Basic Usage
The Problem
After filtering a dataset, factor variables may retain levels that no longer exist in the filtered data. This creates misleading summaries and can affect statistical analyses.
Step 1: Create a factor with filtering
We’ll start by creating a subset of penguins data and observe the unused levels.
# Filter penguins to only Adelie and Chinstrap species
penguins_subset <- penguins |>
  filter(species %in% c("Adelie", "Chinstrap"))

# Check the levels of species factor
levels(penguins_subset$species)
The factor still contains all three original levels, including “Gentoo” which no longer exists in our filtered data.
Step 2: Check the actual data
Let’s verify that “Gentoo” penguins are indeed absent from our subset.
# Count penguins by species
table(penguins_subset$species)

# Check summary
summary(penguins_subset$species)
The table shows 0 Gentoo penguins, but the factor level remains, which can be problematic for analysis.
Step 3: Drop unused levels with droplevels()
Now we’ll remove the unused “Gentoo” level using the droplevels() function.
# Drop unused levels
penguins_clean <- penguins_subset |>
  mutate(species = droplevels(species))

# Verify levels are dropped
levels(penguins_clean$species)
table(penguins_clean$species)
The factor now only contains the two levels that actually exist in our data.
Example 2: Practical Application
The Problem
You’re analyzing car performance data and want to focus only on 4 and 6 cylinder engines, but the factor levels for 8 cylinder engines remain after filtering. This affects your visualization and statistical modeling because empty categories still appear in plots and model outputs.
Step 1: Filter the mtcars dataset
We’ll filter for cars with 4 and 6 cylinders and convert the cylinder variable to a factor.
# Convert cyl to factor and filter
cars_subset <- mtcars |>
  mutate(cyl = factor(cyl)) |>
  filter(cyl %in% c("4", "6"))

# Check the factor levels
levels(cars_subset$cyl)
summary(cars_subset$cyl)
The factor retains the “8” level even though no 8-cylinder cars remain in our dataset.
Step 2: Create a plot to see the problem
Let’s create a boxplot to visualize how unused levels affect our plots.
# Create boxplot with unused levels
cars_subset |>
  ggplot(aes(x = cyl, y = mpg)) +
  geom_boxplot() +
  labs(
    title = "MPG by Cylinder (with unused levels)",
    x = "Cylinders",
    y = "Miles per Gallon"
  ) +
  theme_minimal()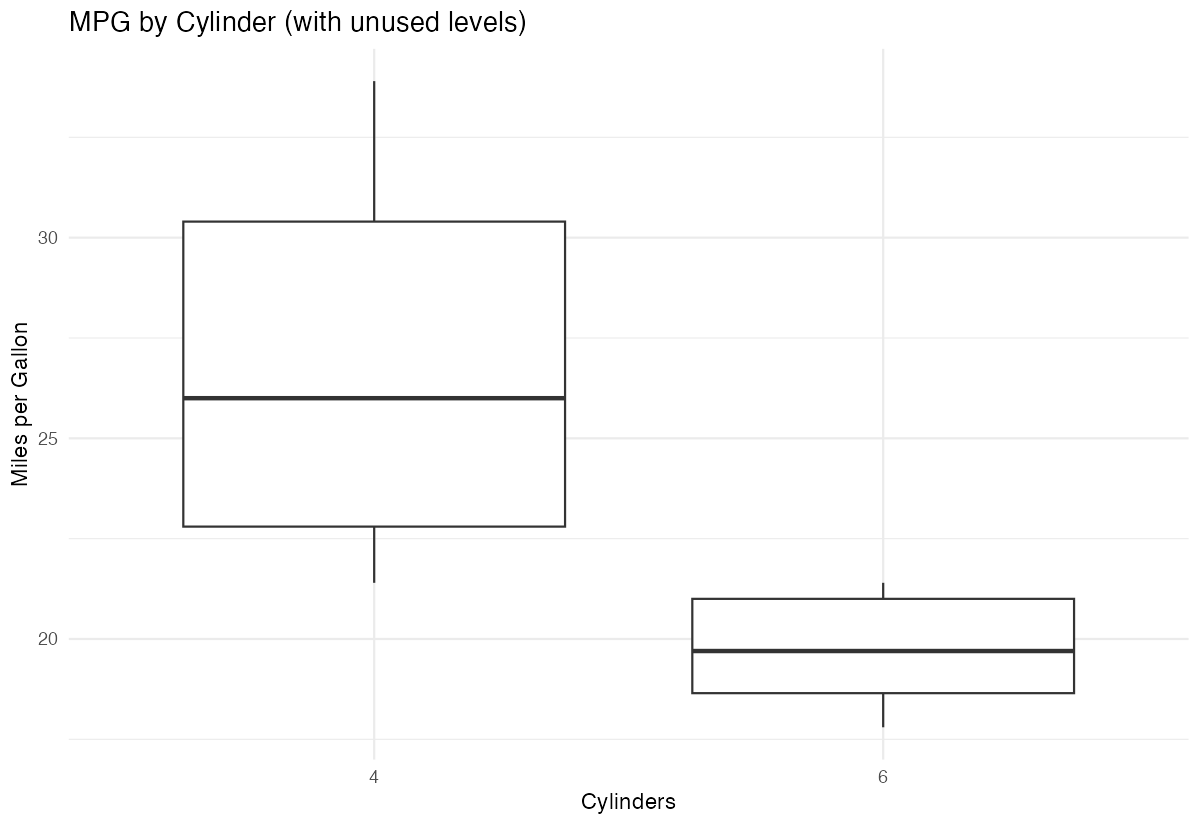
The plot displays an empty box for 8-cylinder cars, which is misleading and wastes space.
Step 3: Drop unused levels and replot
Now we’ll clean the factor and create an improved visualization.
# Drop unused levels using droplevels()
cars_clean <- cars_subset |>
  mutate(cyl = droplevels(cyl))

# Verify the cleaning worked
levels(cars_clean$cyl)
The factor now only contains levels “4” and “6”, matching our filtered data perfectly.
Step 4: Create improved visualization
Let’s create the same plot with cleaned factors to see the improvement.
# Create boxplot with clean factors
cars_clean |>
  ggplot(aes(x = cyl, y = mpg)) +
  geom_boxplot() +
  labs(
    title = "MPG by Cylinder (cleaned)",
    x = "Cylinders",
    y = "Miles per Gallon"
  ) +
  theme_minimal()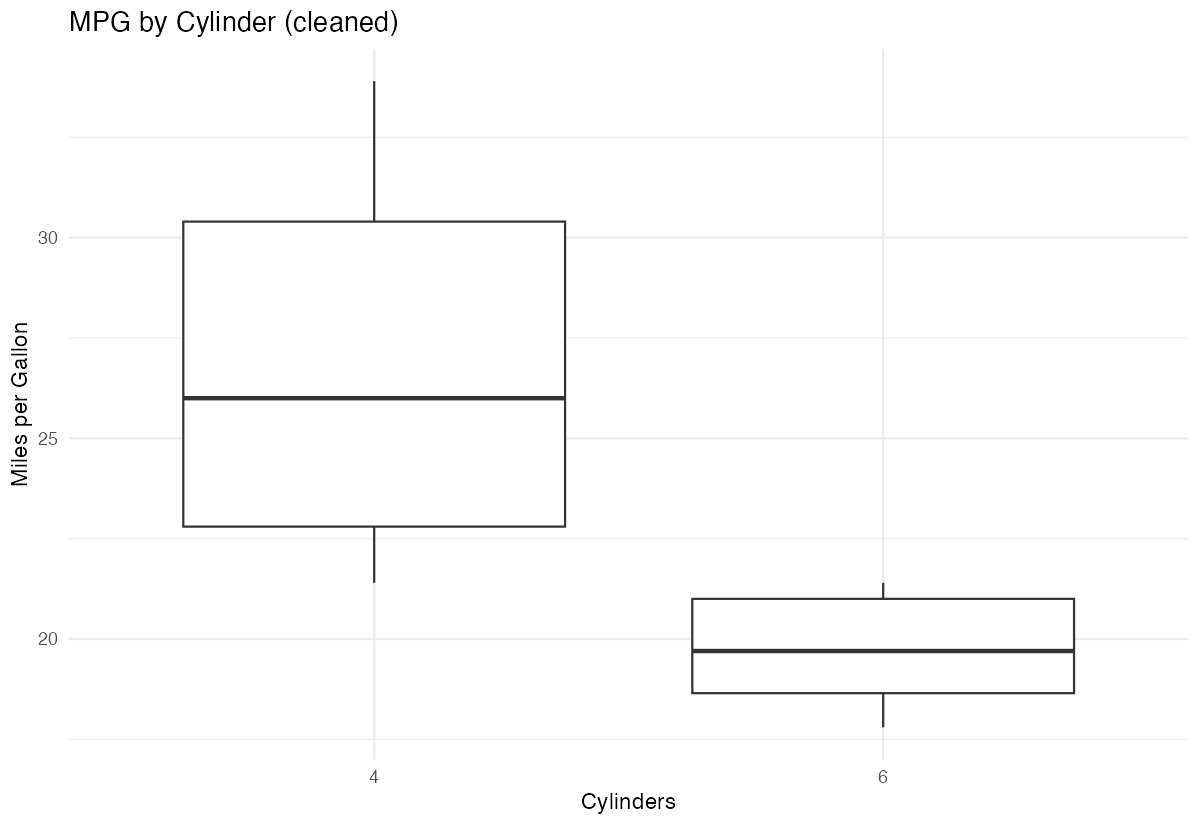
The plot now displays only the relevant categories, providing a cleaner and more accurate visualization.
Summary
- Use
droplevels()to remove unused factor levels after filtering or subsetting data - Unused levels can cause misleading visualizations with empty categories and affect statistical analyses
- Apply
droplevels()withinmutate()when using tidyverse workflows for clean data pipelines - Always verify your factor levels match your actual data using
levels()andtable()functions Dropping unused levels is essential for accurate modeling, plotting, and data summarization