Rstats 101
  • Home
  • LLM
  • dplyr
  • tidyr
  • ggplot2
  • Statistics
  • How-To
  • Base R

ggplot2 Tutorials

Learn data visualization with ggplot2 - the grammar of graphics. These tutorials cover geoms, facets, themes, and customization.

How to use facet_grid() in R

Learn how to use facet_grid() in R with practical examples. Step-by-step guide with code you can copy and run immediately.

How to use facet_wrap() in R

The facetwrap() function from the ggplot2 package creates multiple panels (subplots) of the same plot type, with each panel showing a subset of the…

How to use geom_area() in R

Learn how to use geom_area() in R with practical examples. Step-by-step guide with code you can copy and run immediately.

How to use geom_bar() in R

The geombar() function in ggplot2 creates bar charts by counting the number of cases in each group. It’s one of the most commonly used geoms for…

How to use geom_boxplot() in R

Learn how to use geom_boxplot() in R with practical examples. Step-by-step guide with code you can copy and run immediately.

How to use geom_col() in R

Learn how to use geom_col() in R with practical examples. Step-by-step guide with code you can copy and run immediately.

How to use geom_contour() in R

Learn how to use geom_contour() in R with practical examples. Step-by-step guide with code you can copy and run immediately.

How to use geom_crossbar() in R

Learn how to use geom_crossbar() in R with practical examples. Step-by-step guide with code you can copy and run immediately.

How to use geom_density() in R

The geomdensity() function is a powerful visualization tool in ggplot2 that creates smooth density curves to display the distribution of continuous…

How to use geom_errorbar() in R

Learn how to use geom_errorbar() in R with practical examples. Step-by-step guide with code you can copy and run immediately.

How to use geom_histogram() in R

Learn how to use geom_histogram() in R with practical examples. Step-by-step guide with code you can copy and run immediately.

How to use geom_label() in R

Learn how to use geom_label() in R with practical examples. Step-by-step guide with code you can copy and run immediately.

How to use geom_line() in R

Learn how to use geom_line() in R with practical examples. Step-by-step guide with code you can copy and run immediately.

How to use geom_point() in R

The geompoint() function is one of the most fundamental geometric objects in ggplot2, used to create scatter plots by adding points to a plot. This…

How to use geom_raster() in R

Learn how to use geom_raster() in R with practical examples. Step-by-step guide with code you can copy and run immediately.

How to use geom_ribbon() in R

Learn how to use geom_ribbon() in R with practical examples. Step-by-step guide with code you can copy and run immediately.

How to use geom_smooth() in R

Learn how to use geom_smooth() in R with practical examples. Step-by-step guide with code you can copy and run immediately.

How to use geom_text() in R

Learn how to use geom_text() in R with practical examples. Step-by-step guide with code you can copy and run immediately.

How to use geom_tile() in R

Learn how to use geom_tile() in R with practical examples. Step-by-step guide with code you can copy and run immediately.

How to use geom_violin() in R

The geomviolin() function from the ggplot2 package creates violin plots, which are a combination of box plots and kernel density plots. These plots…

How to use scale_color_manual() in R

Learn how to use scale_color_manual() in R with practical examples. Step-by-step guide with code you can copy and run immediately.

How to use theme_minimal() in R

Learn how to use theme_minimal() in R with practical examples. Step-by-step guide with code you can copy and run immediately.

No matching items

Featured Tutorial

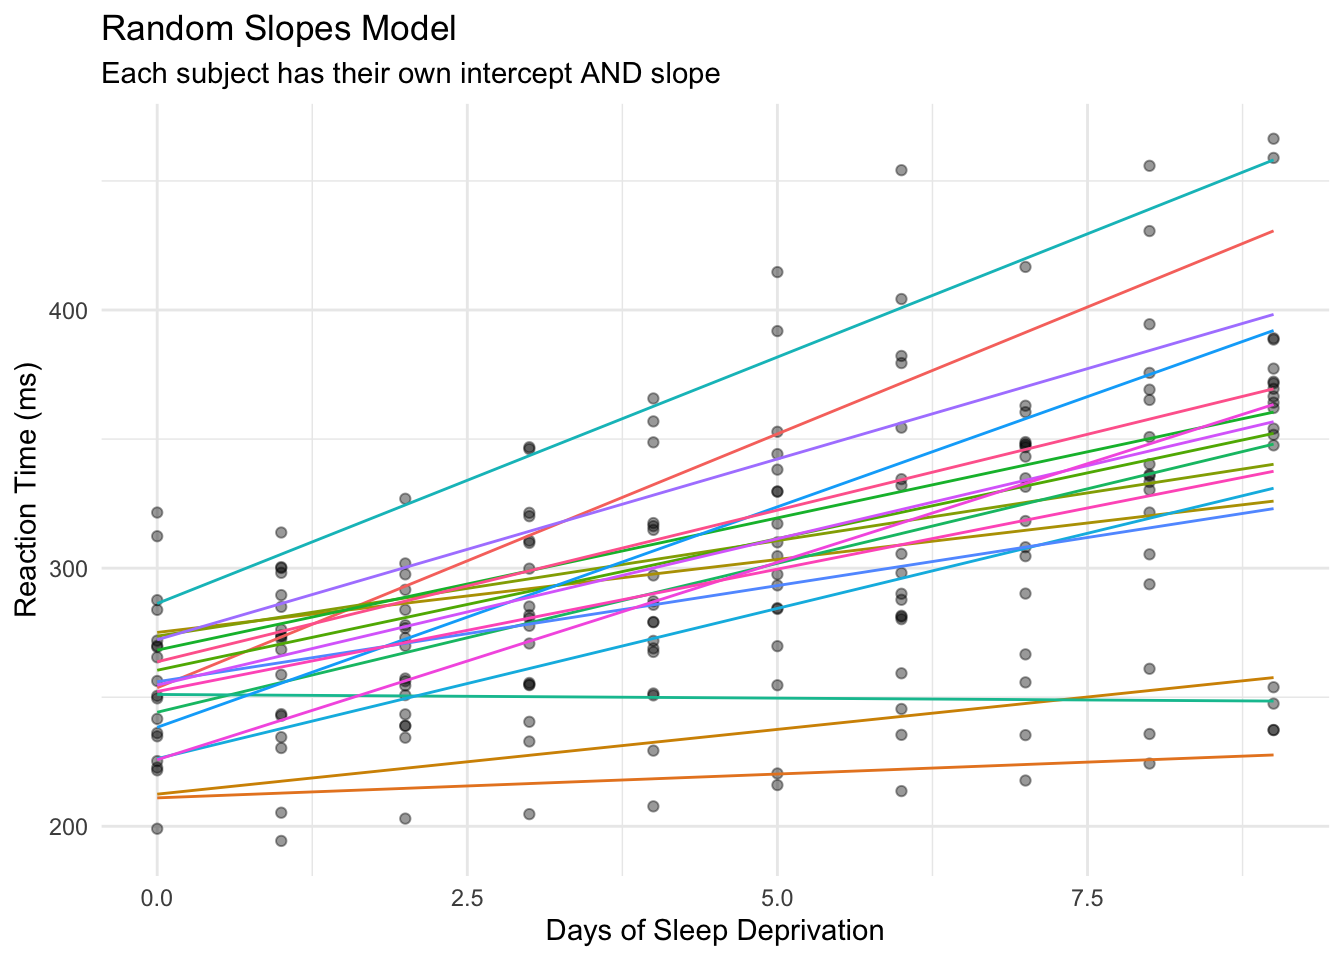
Introduction to Mixed Effects Models

Learn when and why to use mixed models for longitudinal data with lme4

Browse by Topic

dplyr

59 tutorials

Data manipulation with filter, select, mutate, joins & more

tidyr

22 tutorials

Reshape data with pivot_wider, pivot_longer, separate & unite
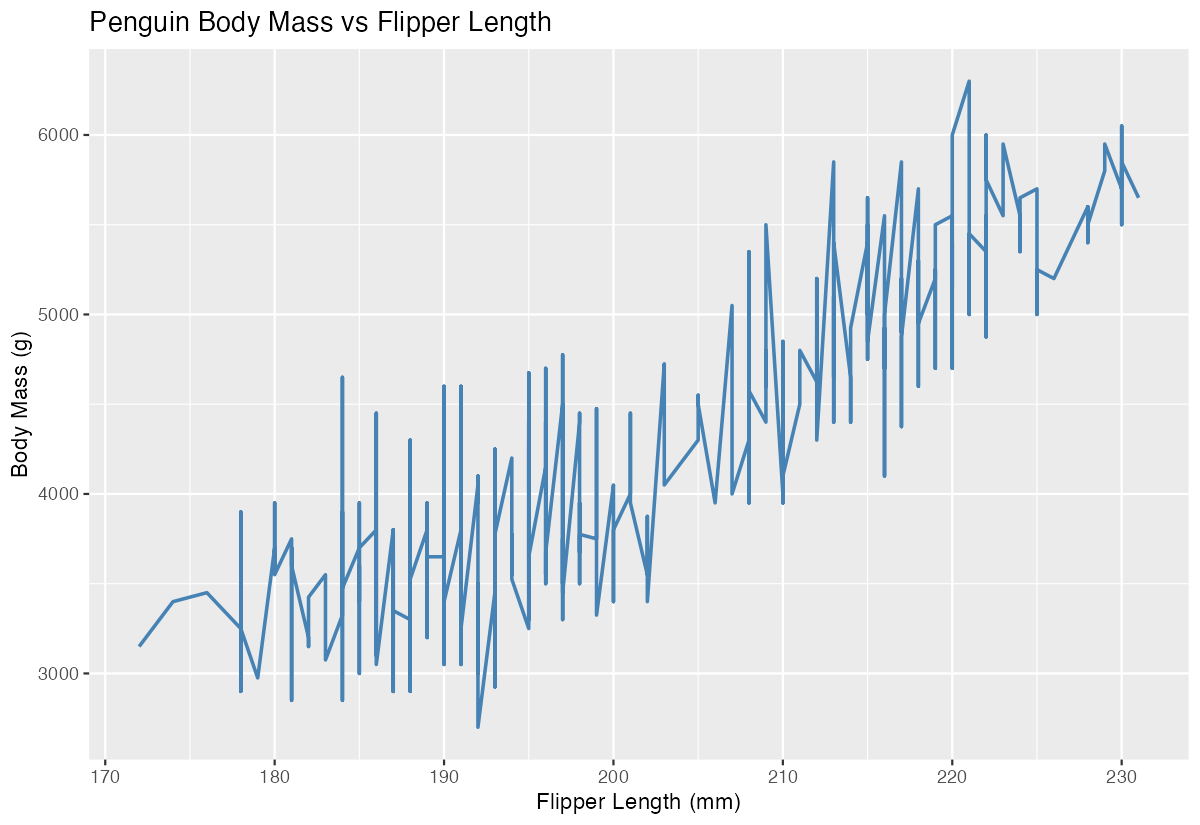
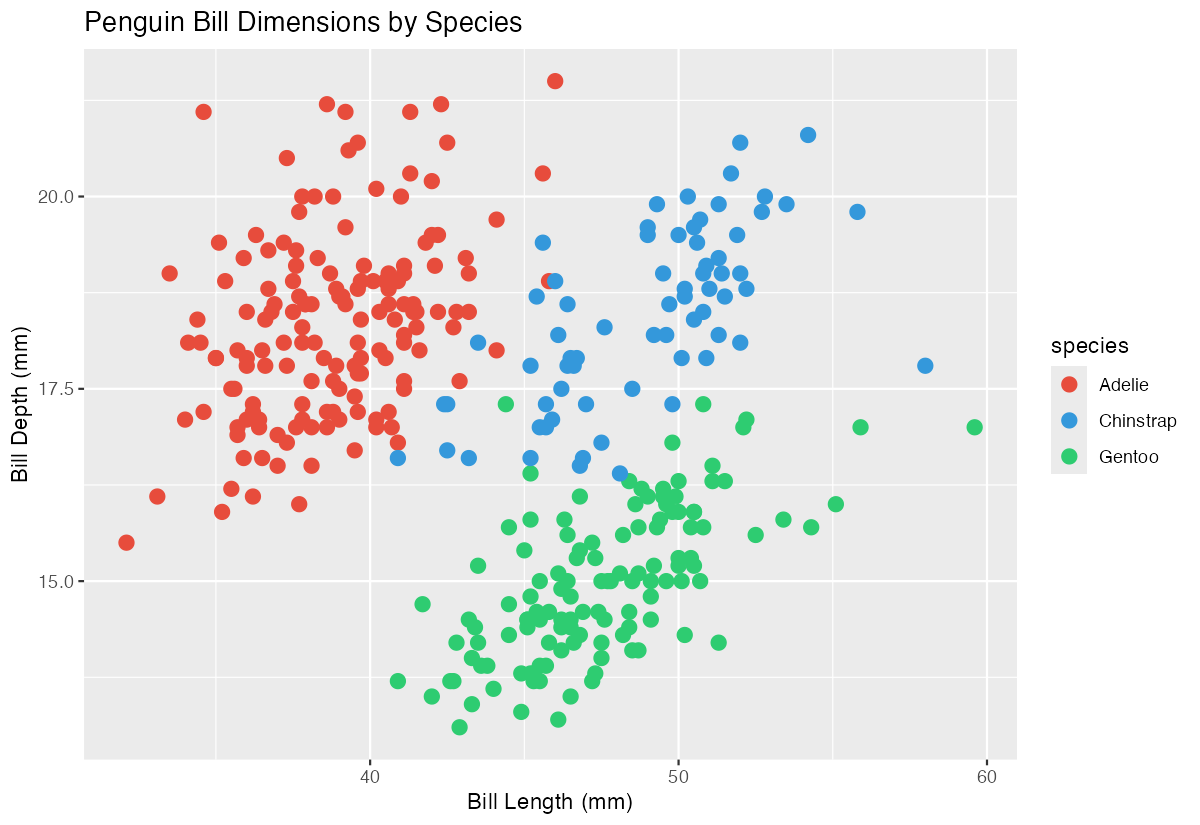
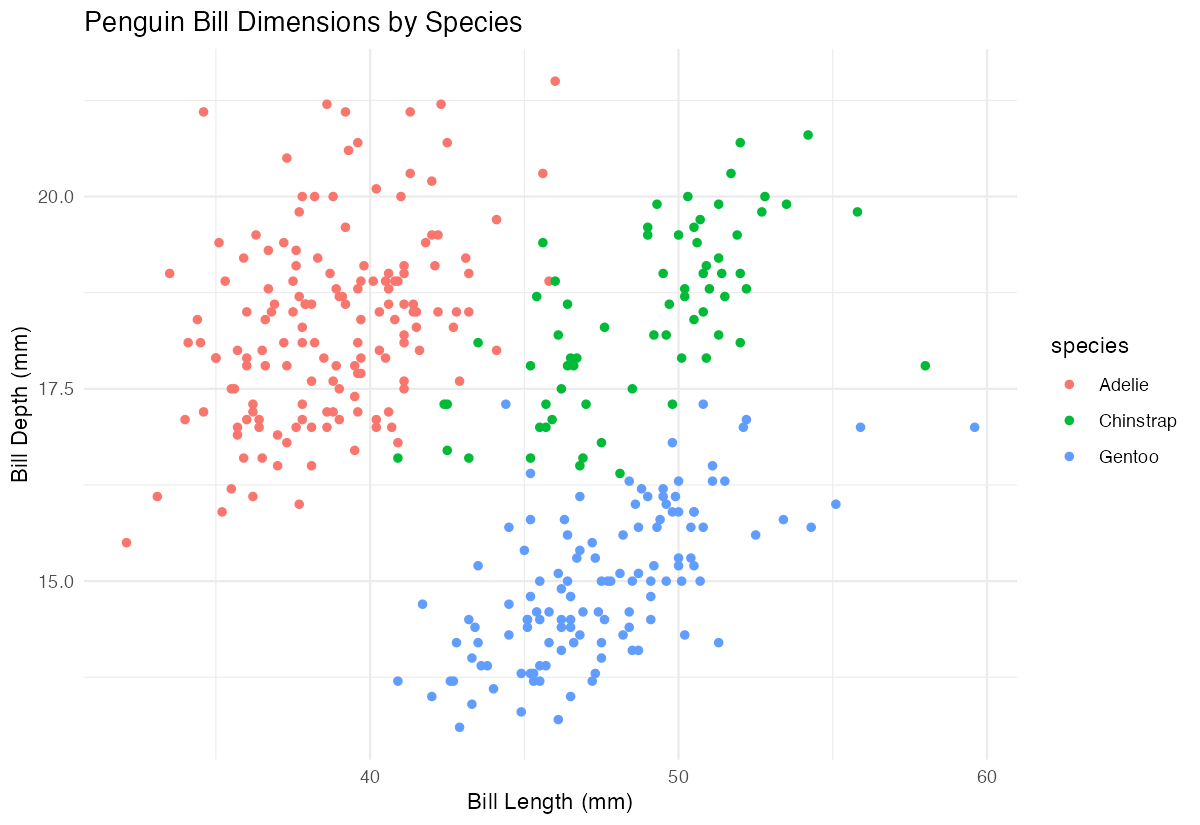
ggplot2

22 tutorials

Create beautiful visualizations with the grammar of graphics

Statistics

31 tutorials

T-tests, ANOVA, regression, correlation & more

How-To

53 tutorials

Practical guides for common R tasks

Base R

21 tutorials

Core R programming fundamentals

Copyright 2025 Rstats101. All rights reserved.

 
  • About

  • Privacy Policy