How to generate random numbers with runif() in R
Introduction
The runif() function is R’s primary tool for generating uniformly distributed random numbers. Unlike normal distributions that cluster around a mean, uniform distributions give equal probability to all values within a specified range. This makes runif() particularly useful for simulations, random sampling, and creating test data where you need values spread evenly across an interval.
Setting Up
Let’s start by loading the required packages and setting up our environment for consistent results.
library(tidyverse)
theme_set(theme_bw(16))
Basic Usage of runif()
The runif() function takes three main arguments: n (number of values to generate), min (minimum value), and max (maximum value). By default, min = 0 and max = 1.
runif(n = 6)This generates 6 random numbers between 0 and 1. Each time you run this code, you’ll get different values because they’re truly random.
Specifying Custom Ranges
You can generate uniform random numbers within any range by specifying the min and max arguments.
runif(n = 6, min = 1, max = 10)This creates 6 random decimal numbers between 1 and 10. Notice that the values can be any decimal within this range, not just whole numbers.
Generating Random Integers
To get random whole numbers, combine runif() with floor() to round down to the nearest integer.
floor(runif(n = 6, min = 1, max = 10))The floor() function truncates the decimal part, giving you integers from 1 to 9. Note that you’ll never get exactly 10 because runif() doesn’t include the maximum value.
Creating Reproducible Random Numbers
For reproducible results in your analysis or teaching, use set.seed() before generating random numbers.
set.seed(432)
floor(runif(n = 6, min = 1, max = 10))
Now every time you run this exact code with the same seed, you’ll get identical results. This is crucial for reproducible research and debugging.
Let’s verify the seed works by running it again:
set.seed(432)
floor(runif(n = 6, min = 1, max = 10))
You should see exactly the same six numbers as before.
Visualizing Uniform Distribution
To understand how uniform distribution works, let’s generate a large sample and visualize it.
set.seed(432)
runif_large <- tibble(x = runif(10000, min = 1, max = 10))
With 10,000 random numbers, we can see the uniform distribution pattern clearly.
runif_large |>
  mutate(x_rounded = ceiling(x)) |>
  ggplot(aes(x = x_rounded)) +
  geom_histogram(binwidth = 1, color = "white", fill = "steelblue")
This histogram should show roughly equal counts in each bin, demonstrating the uniform nature of the distribution.
Let’s add a reference line to highlight the expected frequency:
runif_large |>
  mutate(x_rounded = ceiling(x)) |>
  ggplot(aes(x = x_rounded)) +
  geom_histogram(binwidth = 1, color = "white", fill = "steelblue") +
  geom_hline(yintercept = 1000, color = "red", linetype = "dashed") +
  scale_x_continuous(breaks = 1:10) +
  labs(title = "Distribution of Uniform Random Numbers",
       x = "Value",
       y = "Frequency",
       caption = "Red line shows expected frequency (1000) for perfect uniform distribution") +
  theme_bw(16)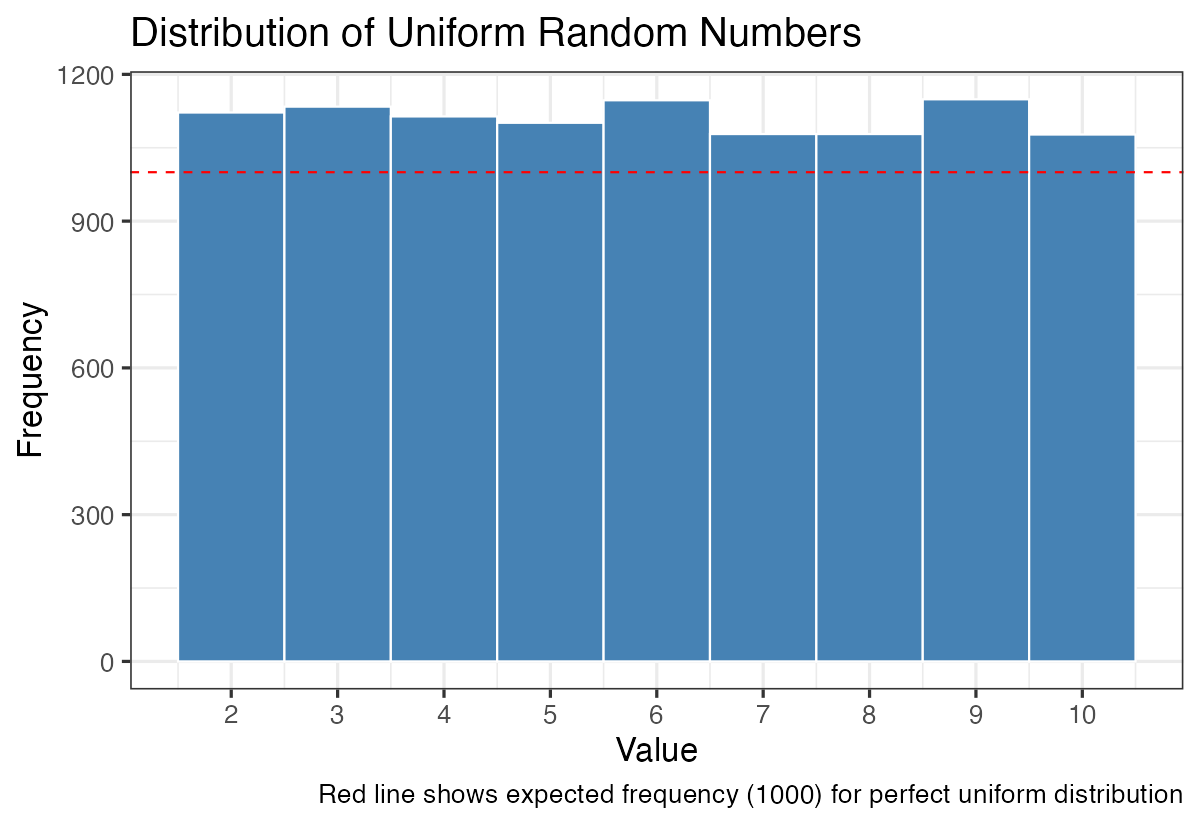
The red dashed line at 1000 represents what we’d expect if the distribution were perfectly uniform (10,000 values ÷ 10 bins = 1000 per bin).
Summary
The runif() function is an essential tool for generating uniform random numbers in R. Remember that it generates values between min and max (excluding the maximum), defaults to the range [0,1), and can be made reproducible using set.seed(). For random integers, combine it with floor() or ceiling(). When working with large samples, uniform distributions show roughly equal frequencies across all possible values, making them ideal for fair sampling and simulation scenarios.