How to use factor in R
Introduction
Factors are R’s way of handling categorical data - variables that have a fixed set of possible values like colors, education levels, or survey responses. They’re essential for statistical modeling and data visualization because they tell R to treat data as categories rather than continuous numbers or arbitrary text.
Getting Started
library(tidyverse)
library(palmerpenguins)
Example 1: Basic Factor Creation and Manipulation
The Problem
We need to convert character data into factors to properly represent categorical variables and control their order for analysis and visualization.
Step 1: Create a basic factor
Let’s start by creating a simple factor from character data.
# Create character vector of penguin species
species_char <- c("Adelie", "Chinstrap", "Gentoo", "Adelie", "Chinstrap")
species_char

# Convert to factor
species_factor <- factor(species_char)
species_factor
The factor automatically identified the unique levels and sorted them alphabetically.
Step 2: Check factor properties
We can examine the structure and levels of our factor.
# Check the levels
levels(species_factor)

# Check if it's a factor
is.factor(species_factor)

# See the underlying structure
str(species_factor)
Notice that factors store data as integers internally, with labels for each level.
Step 3: Control factor level order
Often we want to specify the order of factor levels ourselves.
# Create factor with custom level order
species_ordered <- factor(species_char,
                         levels = c("Gentoo", "Adelie", "Chinstrap"))
species_ordered

# Compare levels
levels(species_ordered)
Now the levels follow our specified order rather than alphabetical order.
Example 2: Working with Real Data
The Problem
We’re analyzing penguin data and need to convert species names to factors, reorder them by size, and handle any potential missing values for proper statistical analysis.
Step 1: Examine the original data
Let’s look at the species column in the penguins dataset.
# Check the species column
penguins |>
  select(species) |>
  head(10)

# Check if it's already a factor
class(penguins$species)
The species column is already a factor, but let’s see how we might modify it.
Step 2: Reorder factor levels by meaningful criteria
We’ll reorder species by their average body mass for more intuitive plotting.
# Calculate average body mass by species
avg_mass <- penguins |>
  group_by(species) |>
  summarise(avg_mass = mean(body_mass_g, na.rm = TRUE)) |>
  arrange(avg_mass)

print(avg_mass)
This shows us the order from smallest to largest average body mass.
Step 3: Apply the new factor ordering
Now we’ll reorder the factor levels based on body mass.
# Reorder species factor by average mass
penguins_ordered <- penguins |>
  mutate(species = factor(species,
                         levels = c("Adelie", "Chinstrap", "Gentoo")))

# Verify the new level order
levels(penguins_ordered$species)
The species are now ordered from smallest to largest average body mass.
Step 4: Create a meaningful visualization
The reordered factor will make our plots more intuitive to read.
# Create a plot using the reordered factor
penguins_ordered |>
  ggplot(aes(x = species, y = body_mass_g)) +
  geom_boxplot() +
  labs(
    title = "Penguin Body Mass by Species",
    x = "Species (ordered by average mass)",
    y = "Body Mass (g)"
  ) +
  theme_minimal()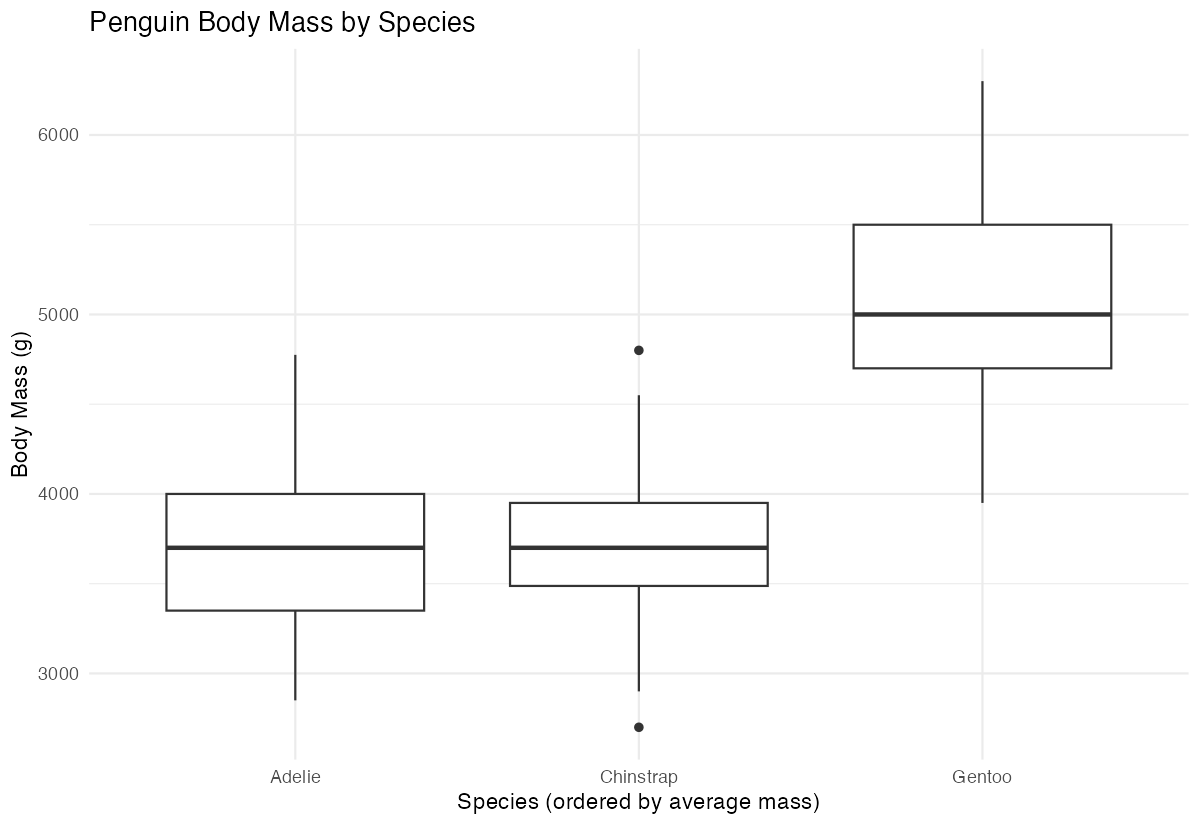
The plot now shows species in order from lightest to heaviest, making comparisons easier.
Summary
• Basic factors: Use factor() to convert character vectors into categorical variables that R can properly analyze • Level control: Specify custom level orders with the levels argument to make your data more meaningful • Data preparation: Convert character columns to factors before statistical modeling and visualization • Reordering strategy: Order factor levels by meaningful criteria (like size, frequency, or logical sequence) rather than alphabetical order • Visualization impact: Properly ordered factors create more intuitive and readable plots and summary tables —