dplyr across(): Compute column-wise mean
Introduction
The across() function in dplyr is a powerful tool for applying functions to multiple columns simultaneously. When computing column-wise means, across() eliminates the need to repeat code for each column, making your analysis more efficient and readable. This function is particularly useful when working with datasets containing multiple numeric variables that require the same statistical operation.
You’ll want to use across() when you need to calculate means for several columns at once, when creating summary statistics for groups of variables, or when you want to apply the same transformation to multiple columns while maintaining clean, reproducible code. It’s especially valuable in exploratory data analysis and when preparing summary reports.
Getting Started
First, let’s load the required packages:
library(tidyverse)
library(palmerpenguins)
Example 1: Basic Usage
Let’s start with a simple example using the penguins dataset to calculate means across all numeric columns:
penguins |>
  summarise(across(where(is.numeric), mean, na.rm = TRUE))
We can also specify columns by name or use selection helpers:
penguins |>
  summarise(across(c(bill_length_mm, bill_depth_mm, flipper_length_mm),
                   mean, na.rm = TRUE))
To make the output more readable, we can add custom names:
penguins |>
  summarise(across(c(bill_length_mm, bill_depth_mm, flipper_length_mm),
                   mean, na.rm = TRUE, .names = "mean_{.col}"))
Example 2: Practical Application
Now let’s explore a more complex real-world scenario. Suppose we want to calculate column-wise means for different penguin species and compare body measurements:
species_means <- penguins |>
  group_by(species) |>
  summarise(across(c(bill_length_mm, bill_depth_mm,
                     flipper_length_mm, body_mass_g),
                   mean, na.rm = TRUE, .names = "avg_{.col}"),
            .groups = "drop")

species_means
We can also create a more comprehensive summary that includes multiple statistics:
penguin_summary <- penguins |>
  group_by(species, island) |>
  summarise(across(c(bill_length_mm, flipper_length_mm, body_mass_g),
                   list(mean = ~mean(.x, na.rm = TRUE),
                        sd = ~sd(.x, na.rm = TRUE)),
                   .names = "{.fn}_{.col}"),
            sample_size = n(),
            .groups = "drop")

penguin_summary
For a practical visualization of our column-wise means, we can reshape and plot the data:
species_means |>
  pivot_longer(cols = starts_with("avg_"),
               names_to = "measurement",
               values_to = "mean_value") |>
  mutate(measurement = str_remove(measurement, "avg_")) |>
  ggplot(aes(x = species, y = mean_value, fill = species)) +
  geom_col() +
  facet_wrap(~measurement, scales = "free_y") +
  theme_minimal() +
  labs(title = "Average Body Measurements by Penguin Species",
       x = "Species", y = "Mean Value") +
  theme(legend.position = "none")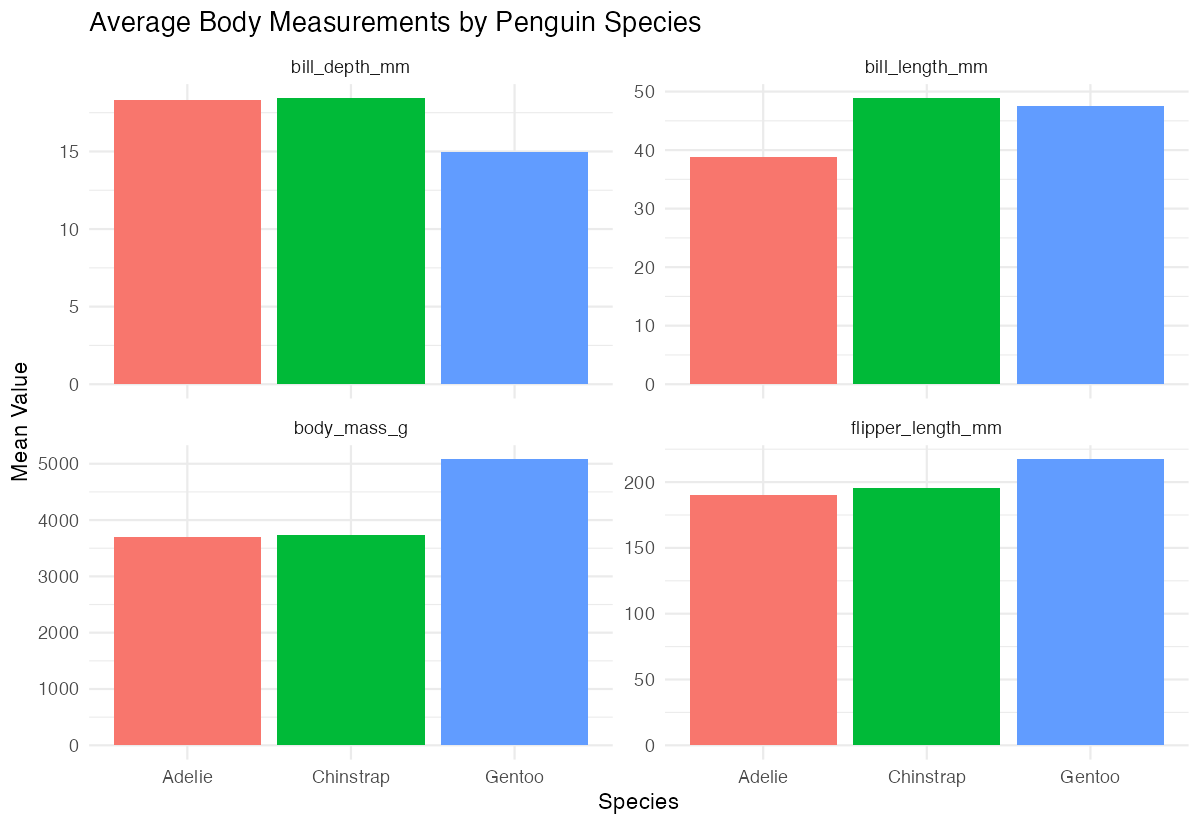
Here’s another practical example using conditional selection to calculate means only for measurements above certain thresholds:
penguins |>
  group_by(species) |>
  summarise(across(where(is.numeric),
                   ~mean(.x[.x > quantile(.x, 0.25, na.rm = TRUE)],
                         na.rm = TRUE),
                   .names = "upper75_mean_{.col}"))