How to remove unused factor levels with droplevels() in R
Introduction
In R, factors retain all their defined levels even when some levels are no longer present in your data after filtering or subsetting. These unused levels can cause problems in modeling, plotting, and analysis by creating empty categories or affecting statistical comparisons. Learning to identify and remove unused factor levels is essential for clean data analysis and accurate visualizations.
Loading Required Packages
We’ll use the tidyverse for data manipulation and the palmerpenguins dataset for our examples.
library(tidyverse)
library(palmerpenguins)
Understanding Factor Levels in the Palmer Penguins Data
Let’s start by examining the structure of our dataset and its factor variables.
penguins |> head()The penguins dataset contains several factor variables. Let’s examine what levels exist in each one.
penguins |>
  pull(species) |>
  levels()
penguins |>
pull(island) |>
levels()penguins |>
pull(sex) |>
levels()These show us all the defined levels for each factor variable in the original dataset.
Identifying Unused Levels After Filtering
When we filter data, factor levels that are no longer present become “unused” but still exist in the factor structure.
df <- penguins |>
  filter(species != "Gentoo")
Now let’s check what species values are actually present in our filtered data versus what levels still exist.
df |>
  pull(species) |>
unique()levels(df$species)Notice that “Gentoo” still appears as a level even though it’s not present in the filtered data.
Removing Unused Levels with Base R
The droplevels() function from base R removes unused levels from factors.
df$species <- droplevels(df$species)
levels(df$species)
Now “Gentoo” is no longer listed as a level since it doesn’t appear in our filtered dataset.
Removing Unused Levels with dplyr
The fct_drop() function from the forcats package (loaded with tidyverse) provides a pipe-friendly way to drop unused levels.
df2 <- penguins |>
  filter(species != "Chinstrap")
df2 <- df2 |>
mutate(species = fct_drop(species))levels(df2$species)This approach integrates smoothly into tidyverse workflows using mutate().
Why Unused Levels Matter in Visualization
Unused levels can affect your plots by creating empty spaces or categories.
df |>
  ggplot(aes(x = species, y = body_mass_g, fill = island)) +
  geom_boxplot()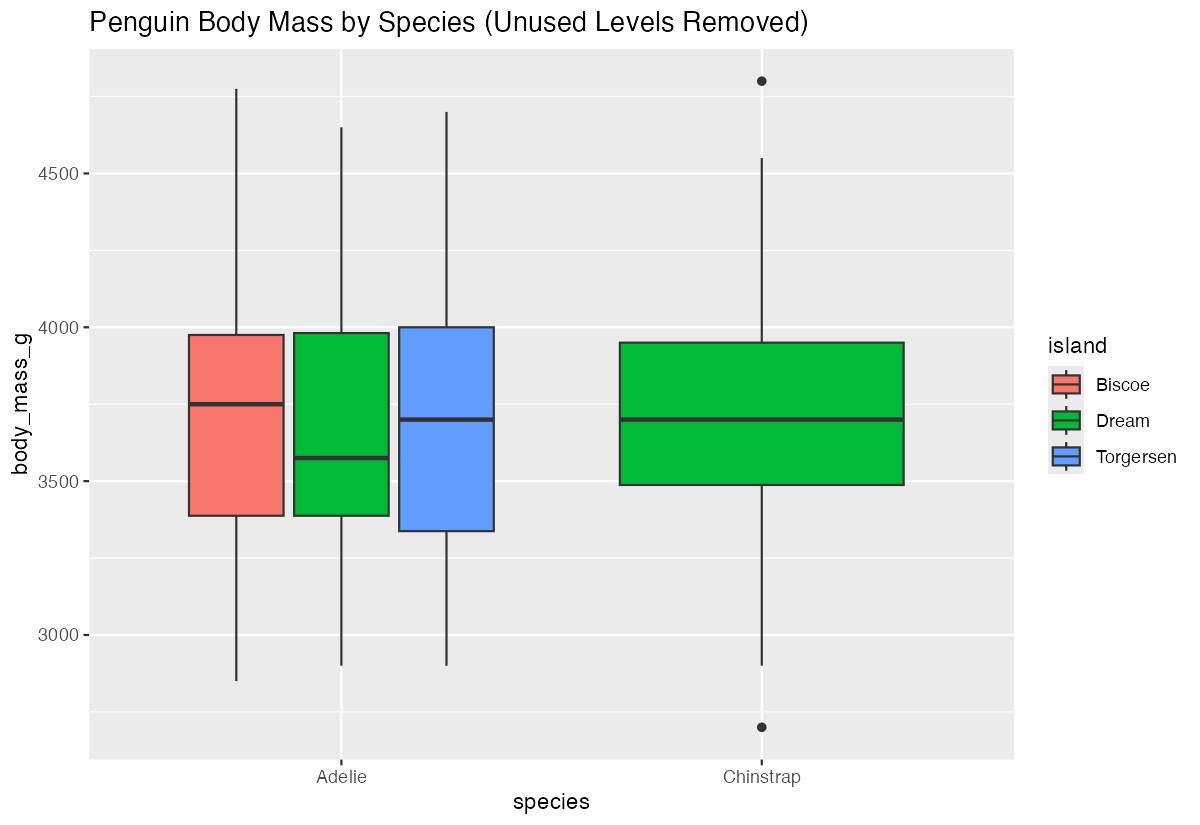
With unused levels removed, your plots will only show the categories that actually contain data, making them cleaner and more informative.
Impact on Statistical Models
Unused factor levels can also affect statistical modeling by creating empty reference categories.
data <- data.frame(
  category = factor(c("A", "B", "C", "A", "B"),
                   levels = c("A", "B", "C", "D")),
  value = c(1, 2, 3, 4, 5)
)
model <- lm(value ~ category, data = data)
summary(model)The model will include level “D” even though it has no observations, which can complicate interpretation of results.
Unused Levels in Plotting
Bar plots and other visualizations may show empty categories when unused levels are present.
df_example <- data.frame(
  category = factor(c("A", "A", "B"), levels = c("A", "B", "C")),
  value = c(3, 4, 5)
)ggplot(df_example, aes(x = category, y = value)) +
geom_col()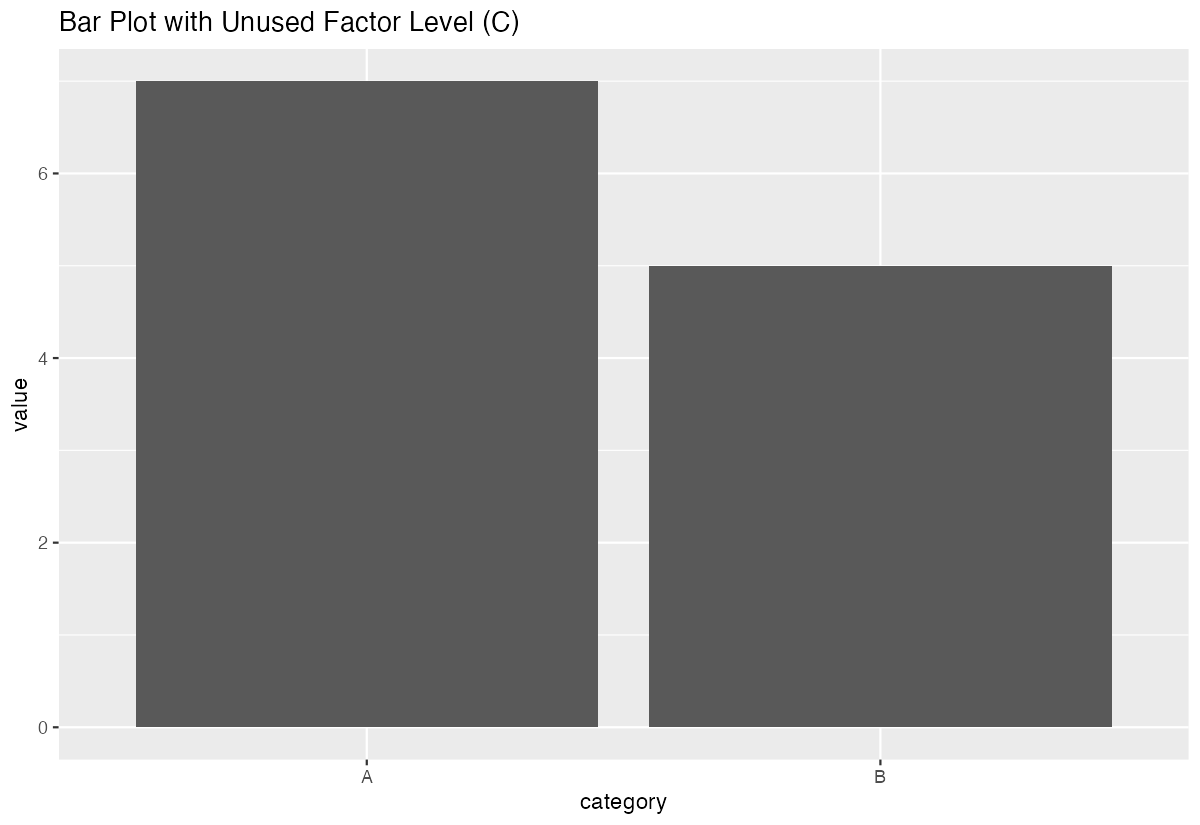
The plot will show category “C” on the x-axis even though it has no data, potentially confusing your audience.
Best Practices
Always check for unused levels after filtering or subsetting factor data, especially before modeling or plotting.
# Check levels after filtering
filtered_data |> pull(factor_variable) |> levels()

# Remove unused levels as needed
filtered_data <- filtered_data |>
  mutate(factor_variable = fct_drop(factor_variable))
This ensures your analysis reflects only the categories actually present in your data.
Summary
Unused factor levels are a common issue when working with filtered or subsetted data in R. They can lead to misleading plots, unnecessarily complex statistical models, and confusing results. Use droplevels() in base R or fct_drop() from the forcats package to remove unused levels after filtering your data. Making this a regular part of your data cleaning workflow will lead to cleaner visualizations and more accurate analyses.