How to use drop_na() in R
Introduction
The drop_na() function from the tidyr package removes rows containing missing values (NA) from your data. This function is essential for data cleaning when you need complete cases for analysis or when missing values would interfere with your statistical procedures.
Getting Started
library(tidyverse)
library(palmerpenguins)
Example 1: Basic Usage
The Problem
The penguins dataset contains some missing values that we need to remove. Let’s explore how to clean this data by removing rows with any missing values.
Step 1: Examine the data structure
First, let’s look at the penguins dataset to understand what we’re working with.
# Check the structure and missing values
penguins |>
  head(10)

# Count missing values per column
penguins |>
  summarise(across(everything(), ~sum(is.na(.))))
This shows us the dataset structure and reveals which columns contain missing values.
Step 2: Remove all rows with any missing values
Now we’ll use drop_na() without arguments to remove any row containing at least one missing value.
# Remove all rows with any missing values
clean_penguins <- penguins |>
  drop_na()

# Check the dimensions
nrow(penguins)
nrow(clean_penguins)
The dataset is reduced from 344 to 333 rows, removing 11 rows that contained missing values.
Step 3: Verify the cleaning worked
Let’s confirm that no missing values remain in our cleaned dataset.
# Verify no missing values remain
clean_penguins |>
  summarise(across(everything(), ~sum(is.na(.))))

# Alternative verification
anyNA(clean_penguins)
The output confirms our dataset now has zero missing values across all columns.
Example 2: Practical Application
The Problem
In real analysis, you might only care about missing values in specific columns that are critical for your analysis. For instance, when studying penguin body mass, missing values in other variables shouldn’t disqualify entire observations.
Step 1: Identify critical variables
Let’s say we’re analyzing the relationship between bill dimensions and body mass, so these are our critical variables.
# Examine missing values in critical columns
penguins |>
  select(bill_length_mm, bill_depth_mm, body_mass_g) |>
  summarise(across(everything(), ~sum(is.na(.))))

# Show some rows with missing values
penguins |>
  filter(if_any(c(bill_length_mm, bill_depth_mm, body_mass_g), is.na))
This reveals which specific observations have missing values in our variables of interest.
Step 2: Remove rows missing critical variables only
Now we’ll use drop_na() with specific column names to preserve more data.
# Remove rows missing only critical variables
analysis_ready <- penguins |>
  drop_na(bill_length_mm, bill_depth_mm, body_mass_g)

# Compare sample sizes
nrow(penguins)
nrow(analysis_ready)
This approach preserves more observations by only removing rows missing values in our analysis variables.
Step 3: Verify and prepare for analysis
Let’s confirm our data is ready and demonstrate it works for analysis.
# Check that critical variables have no missing values
analysis_ready |>
  select(bill_length_mm, bill_depth_mm, body_mass_g) |>
  summarise(across(everything(), ~sum(is.na(.))))

# Create a quick visualization to confirm data quality
analysis_ready |>
  ggplot(aes(x = bill_length_mm, y = body_mass_g, color = species)) +
  geom_point(alpha = 0.7, size = 2.5) +
  labs(
    title = "Bill Length vs Body Mass After Removing Missing Values",
    x = "Bill Length (mm)",
    y = "Body Mass (g)",
    color = "Species"
  ) +
  theme_minimal()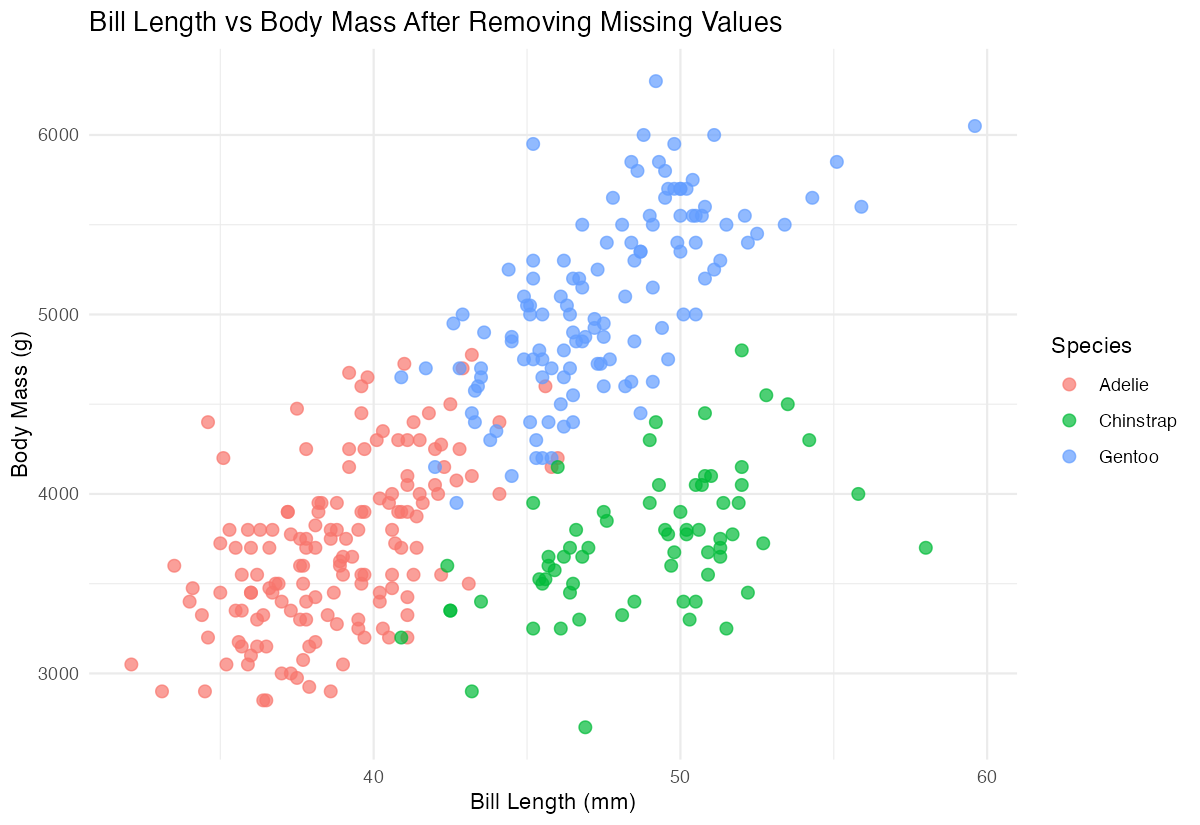
The visualization runs without errors, confirming our data cleaning was successful and the data is analysis-ready.
Summary
drop_na()removes rows containing missing values, with no arguments removing any row with any NA- Specify column names in
drop_na(col1, col2)to only remove rows missing values in those specific columns
- Use
drop_na()before analysis when missing values would cause problems or bias results - Always verify your cleaning worked by checking dimensions and confirming no unwanted NAs remain
Consider whether removing entire rows is appropriate or if imputation might be better for your use case