pivot_longer on dataframe with single row
Introduction
The pivot_longer() function works seamlessly with single-row dataframes, transforming wide format data into long format by converting column names into values. This is particularly useful when you have summary statistics, aggregated data, or measurement data stored in a wide format that needs to be reshaped for visualization or analysis.
Getting Started
library(tidyverse)
library(palmerpenguins)
Example 1: Basic Usage
The Problem
You have a single row of data with multiple columns representing different measurements, and you need to convert it to long format for plotting or analysis.
Step 1: Create a wide single-row dataframe
Let’s start with a simple example using summary statistics.
# Create a single row with multiple measurements
wide_data <- data.frame(
  sample_id = "A1",
  temperature = 23.5,
  humidity = 65.2,
  pressure = 1013.25
)
wide_data
This creates a dataframe with one row containing three different measurements.
Step 2: Apply pivot_longer to reshape the data
Now we’ll transform this wide data into long format.
# Pivot all measurement columns to long format
long_data <- wide_data |>
  pivot_longer(
    cols = c(temperature, humidity, pressure),
    names_to = "measurement_type",
    values_to = "value"
  )
long_data
The single row has been transformed into three rows, with measurement types as categorical data and their values in a separate column.
Step 3: Verify the transformation
Let’s examine the structure of our transformed data.
# Check dimensions and structure
dim(long_data)
str(long_data)
We now have 3 rows and 3 columns instead of 1 row and 4 columns, making the data ready for ggplot2 visualization.
Example 2: Practical Application
The Problem
You have calculated summary statistics for penguin species from the Palmer Penguins dataset, resulting in a single row of means. You want to create a bar chart comparing these means, which requires the data in long format.
Step 1: Calculate means for each species
First, let’s create summary statistics that result in a single-row dataframe.
# Calculate mean bill length for each species
species_means <- penguins |>
  group_by(species) |>
  summarise(mean_bill_length = mean(bill_length_mm, na.rm = TRUE)) |>
  pivot_wider(names_from = species, values_from = mean_bill_length)
species_means
This creates a single row with mean bill lengths for Adelie, Chinstrap, and Gentoo penguins.
Step 2: Transform to long format for visualization
Now we’ll reshape this single-row summary for plotting.
# Pivot the species means to long format
species_long <- species_means |>
  pivot_longer(
    cols = everything(),
    names_to = "species",
    values_to = "mean_bill_length"
  )
species_long
The wide format with three columns is now converted to long format with species names and their corresponding mean values.
Step 3: Create visualization with the transformed data
With the data in long format, we can easily create a bar chart.
# Create a bar chart using the long format data
species_long |>
  ggplot(aes(x = species, y = mean_bill_length, fill = species)) +
  geom_col() +
  labs(
    title = "Mean Bill Length by Penguin Species",
    x = "Species",
    y = "Mean Bill Length (mm)"
  ) +
  theme_minimal() +
  theme(legend.position = "none")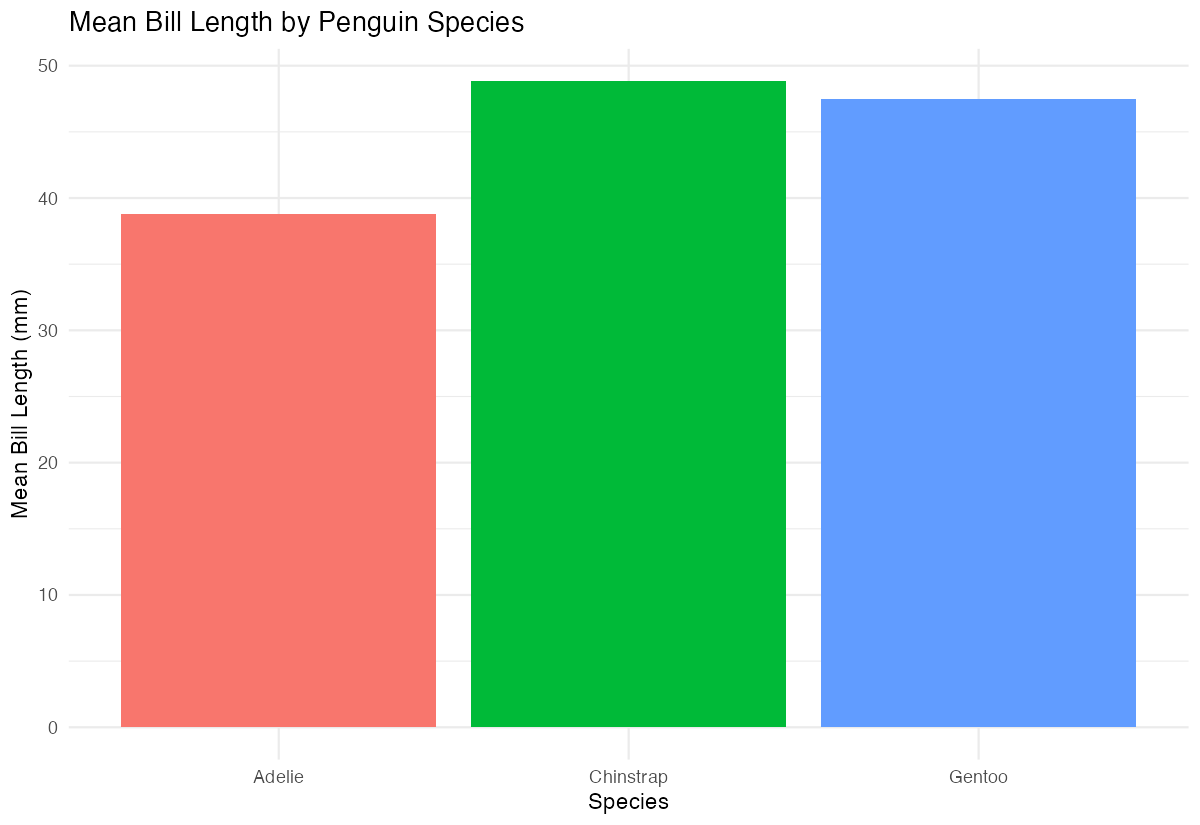
The long format makes it straightforward to map species to the x-axis and mean values to the y-axis in ggplot2.
Step 4: Handle multiple measurements
Let’s extend this to include multiple measurements in our summary.
# Create a more complex single-row summary
multi_summary <- penguins |>
  summarise(
    mean_bill_length = mean(bill_length_mm, na.rm = TRUE),
    mean_bill_depth = mean(bill_depth_mm, na.rm = TRUE),
    mean_flipper_length = mean(flipper_length_mm, na.rm = TRUE)
  ) |>
  pivot_longer(
    cols = everything(),
    names_to = "measurement",
    values_to = "mean_value"
  )
multi_summary
This approach works well when you have multiple summary statistics that need to be compared or visualized together.
Summary
pivot_longer()effectively transforms single-row dataframes from wide to long format- Use
colsparameter to specify which columns to pivot (can useeverything()for all columns) - The
names_toparameter creates a new column containing the original column names - The
values_toparameter creates a new column containing the corresponding values Long format data from single rows is particularly useful for creating comparative visualizations in ggplot2