How to Spearman correlation in R
Introduction
Spearman correlation measures the monotonic relationship between two variables, making it ideal when your data doesn’t follow a normal distribution or contains outliers. Unlike Pearson correlation, it works with ranked data and captures relationships that might be curved but consistently increasing or decreasing.
Getting Started
library(tidyverse)
library(palmerpenguins)
Example 1: Basic Usage
The Problem
We want to examine the relationship between penguin flipper length and body mass. Since biological data often contains outliers and may not be perfectly linear, Spearman correlation is more appropriate than Pearson.
Step 1: Examine the Data
Let’s first look at our penguin data to understand what we’re working with.
# Load and examine the penguins dataset
data(penguins)
penguins |>
  select(flipper_length_mm, body_mass_g) |>
  summary()
This shows us the distribution of flipper length and body mass, including any missing values we need to handle.
Step 2: Calculate Basic Spearman Correlation
Now we’ll compute the Spearman correlation coefficient between these two variables.
# Calculate Spearman correlation
cor(penguins$flipper_length_mm,
    penguins$body_mass_g,
    method = "spearman",
    use = "complete.obs")
The result gives us a correlation coefficient close to 0.87, indicating a strong positive monotonic relationship between flipper length and body mass.
Step 3: Get Statistical Significance
We need to test whether this correlation is statistically significant.
# Perform correlation test
cor.test(penguins$flipper_length_mm,
         penguins$body_mass_g,
         method = "spearman")
The p-value (likely < 2.2e-16) confirms this correlation is highly significant, meaning we can be confident the relationship isn’t due to random chance.
Example 2: Practical Application
The Problem
A marine biologist wants to compare Spearman and Pearson correlations across different penguin species to understand which correlation method better captures the flipper-mass relationship. They also need to create a correlation matrix for multiple variables.
Step 1: Compare Correlation Methods by Species
Let’s calculate both Spearman and Pearson correlations for each penguin species.
# Compare correlation methods by species
penguin_cors <- penguins |>
  drop_na(flipper_length_mm, body_mass_g) |>
  group_by(species) |>
  summarise(
    spearman = cor(flipper_length_mm, body_mass_g, method = "spearman"),
    pearson = cor(flipper_length_mm, body_mass_g, method = "pearson")
  )
This reveals how the two correlation methods differ across species, helping us understand which captures the relationship better.
Step 2: Create a Correlation Matrix
Now we’ll examine correlations between multiple numeric variables simultaneously.
# Create Spearman correlation matrix
numeric_vars <- penguins |>
  select(bill_length_mm, bill_depth_mm,
         flipper_length_mm, body_mass_g) |>
  drop_na()

cor_matrix <- cor(numeric_vars, method = "spearman")
round(cor_matrix, 3)
The correlation matrix shows all pairwise Spearman correlations, revealing unexpected relationships like the negative correlation between bill length and bill depth.
Step 3: Visualize the Relationships
Finally, let’s create a visualization to better understand these monotonic relationships.
# Create scatterplot with smooth curve
penguins |>
  filter(!is.na(flipper_length_mm), !is.na(body_mass_g)) |>
  ggplot(aes(x = flipper_length_mm, y = body_mass_g)) +
  geom_point(alpha = 0.6) +
  geom_smooth(method = "loess", se = FALSE) +
  labs(title = "Penguin Flipper Length vs Body Mass",
       subtitle = "Spearman correlation captures monotonic relationship")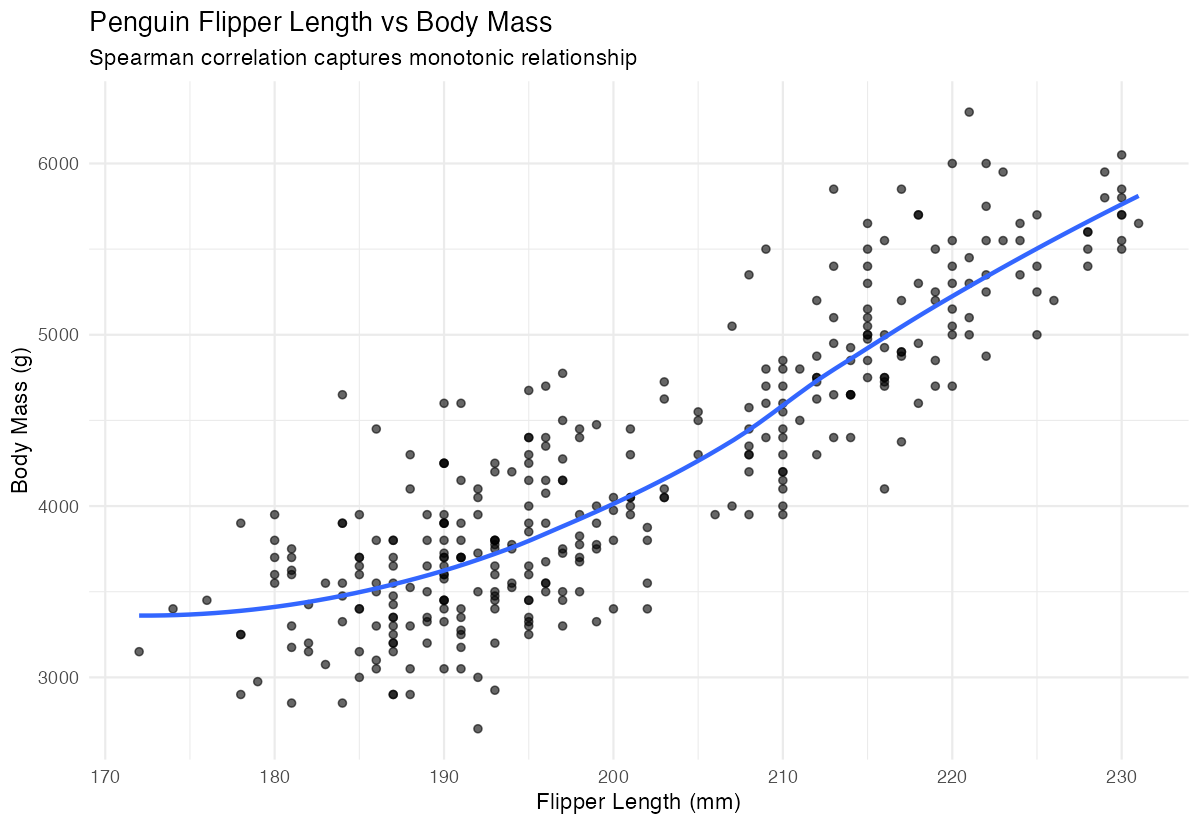
This visualization shows why Spearman correlation is appropriate - the relationship is clearly monotonic but may not be perfectly linear.
Summary
- Spearman correlation measures monotonic relationships and is robust to outliers and non-normal distributions
- Use
method = "spearman"in bothcor()andcor.test()functions - Always include
use = "complete.obs"to handle missing values appropriately - Spearman correlation works with ranked data, making it ideal for ordinal variables
Compare with Pearson correlation to understand whether non-linear monotonic patterns exist in your data