How to use geom_crossbar() in R
Introduction
The geom_crossbar() function in ggplot2 creates crossbar plots that display the middle value (like a mean or median) with error bars extending above and below. This visualization is particularly useful for showing statistical summaries with confidence intervals, standard errors, or other measures of uncertainty across different groups.
Getting Started
library(tidyverse)
library(palmerpenguins)
Example 1: Basic Usage
The Problem
We want to create a simple crossbar plot showing the average bill length for each penguin species. This will help us visualize both the central tendency and variability in our data.
Step 1: Prepare the summary data
First, we need to calculate the mean, minimum, and maximum values for each species.
penguin_summary <- penguins |>
  filter(!is.na(bill_length_mm)) |>
  group_by(species) |>
  summarise(
    mean_bill = mean(bill_length_mm),
    min_bill = min(bill_length_mm),
    max_bill = max(bill_length_mm)
  )
This creates a summary dataset with the statistics we need for our crossbars.
Step 2: Create the basic crossbar plot
Now we’ll create our first crossbar plot using the summary statistics.
ggplot(penguin_summary, aes(x = species)) +
  geom_crossbar(
    aes(y = mean_bill,
        ymin = min_bill,
        ymax = max_bill)
  ) +
  labs(title = "Bill Length by Penguin Species")
The crossbar shows the mean as a horizontal line with vertical bars extending to the minimum and maximum values for each species.
Step 3: Customize the appearance
Let’s improve the visual appeal by adjusting colors and width.
ggplot(penguin_summary, aes(x = species)) +
  geom_crossbar(
    aes(y = mean_bill,
        ymin = min_bill,
        ymax = max_bill),
    fill = "lightblue",
    color = "darkblue",
    width = 0.5
  ) +
  labs(title = "Bill Length Range by Penguin Species",
       subtitle = "Crossbars span min to max; horizontal line is mean",
       x = "Species", y = "Bill Length (mm)") +
  theme_minimal()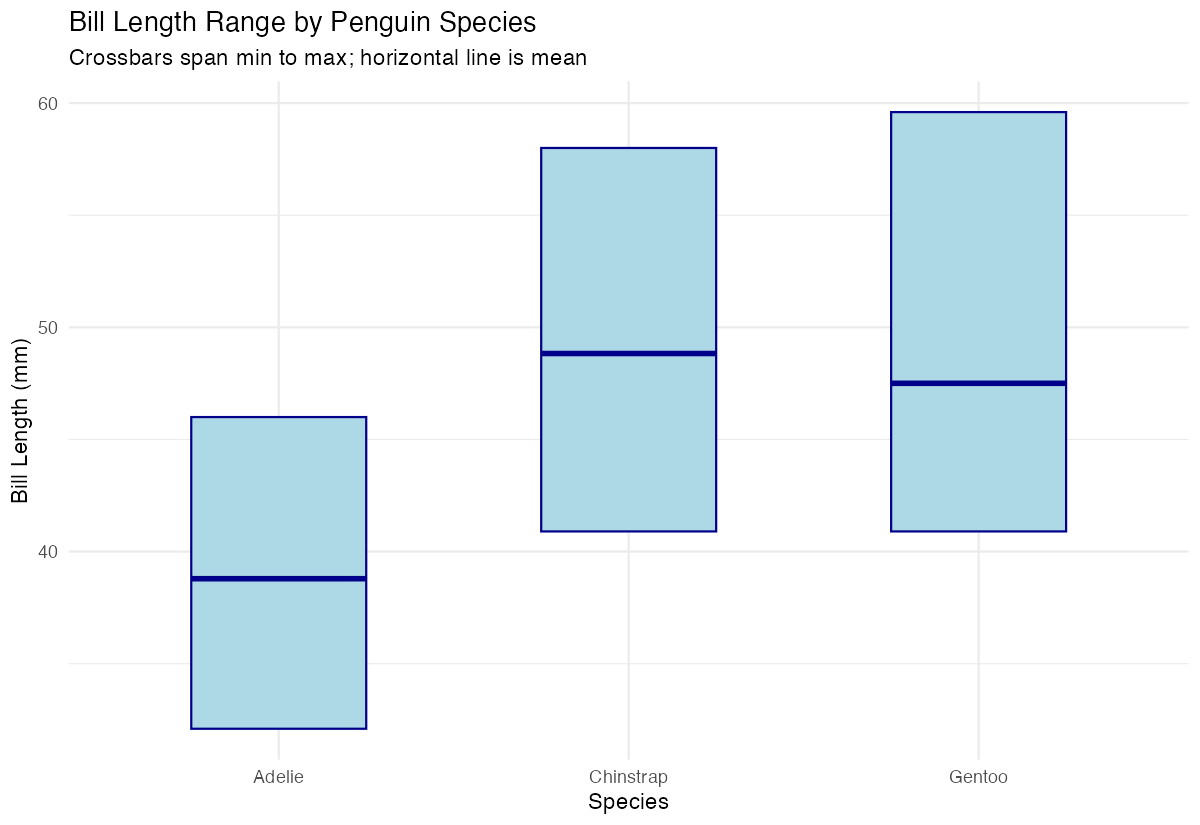
The crossbars now have a light blue fill with dark blue borders and are narrower for better visual clarity.
Example 2: Practical Application
The Problem
A researcher wants to compare body mass across penguin species and islands, showing both the mean and standard error for each group. This requires a more sophisticated statistical summary and grouping structure to provide meaningful insights for publication.
Step 1: Calculate means and standard errors
We’ll create a comprehensive summary that includes standard errors for proper statistical representation.
mass_summary <- penguins |>
  filter(!is.na(body_mass_g), !is.na(island)) |>
  group_by(species, island) |>
  summarise(
    mean_mass = mean(body_mass_g),
    se_mass = sd(body_mass_g) / sqrt(n()),
    .groups = "drop"
  )
This calculates the mean body mass and standard error for each species-island combination.
Step 2: Create crossbars with error bars
Now we’ll plot crossbars showing mean ± standard error for each group.
mass_summary <- mass_summary |>
  mutate(
    ymin = mean_mass - se_mass,
    ymax = mean_mass + se_mass
  )

ggplot(mass_summary, aes(x = species, fill = island)) +
  geom_crossbar(
    aes(y = mean_mass, ymin = ymin, ymax = ymax),
    position = position_dodge(width = 0.8)
  )
The position_dodge() separates the crossbars by island, making it easy to compare across both species and islands.
Step 3: Add professional styling
Let’s create a publication-ready version with improved aesthetics.
ggplot(mass_summary, aes(x = species, fill = island)) +
  geom_crossbar(
    aes(y = mean_mass, ymin = ymin, ymax = ymax),
    position = position_dodge(width = 0.8),
    width = 0.6
  ) +
  scale_fill_viridis_d(name = "Island") +
  labs(
    title = "Penguin Body Mass by Species and Island",
    subtitle = "Mean ± standard error",
    x = "Species",
    y = "Body Mass (g)"
  ) +
  theme_minimal()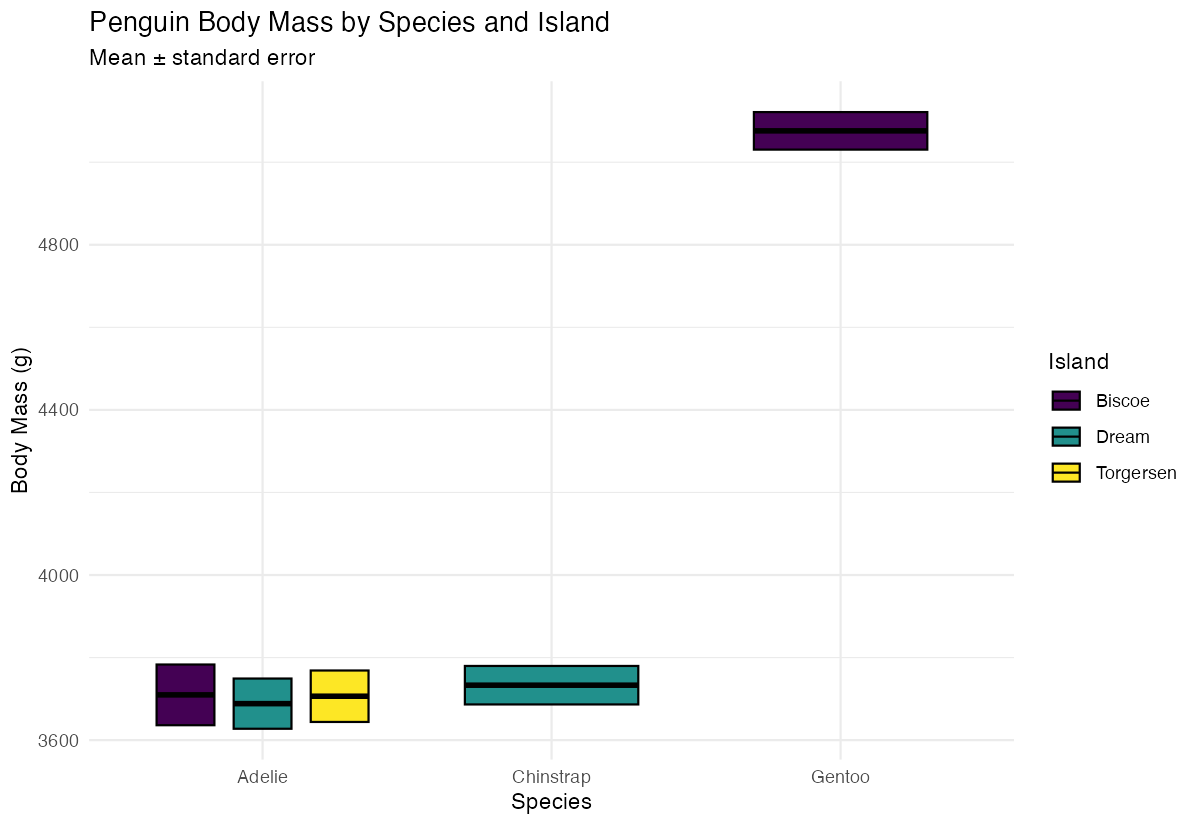
This creates a polished visualization with a color-blind friendly palette and clean styling suitable for reports or presentations.
Summary
geom_crossbar()displays a central value with upper and lower bounds using horizontal and vertical lines- Requires
y,ymin, andymaxaesthetics to define the crossbar dimensions - Use
position_dodge()to separate multiple groups within the same x-axis category - Customize appearance with
fill,color, andwidthparameters for better visual impact Perfect for showing statistical summaries like means with confidence intervals or standard errors