How to use geom_text() in R
Introduction
The geom_text() function in ggplot2 allows you to add text labels directly to your plots, making it easier to annotate data points or highlight specific values. This is particularly useful when you want to display exact values, identify outliers, or add contextual information to your visualizations.
Getting Started
library(tidyverse)
library(palmerpenguins)
Example 1: Basic Usage
The Problem
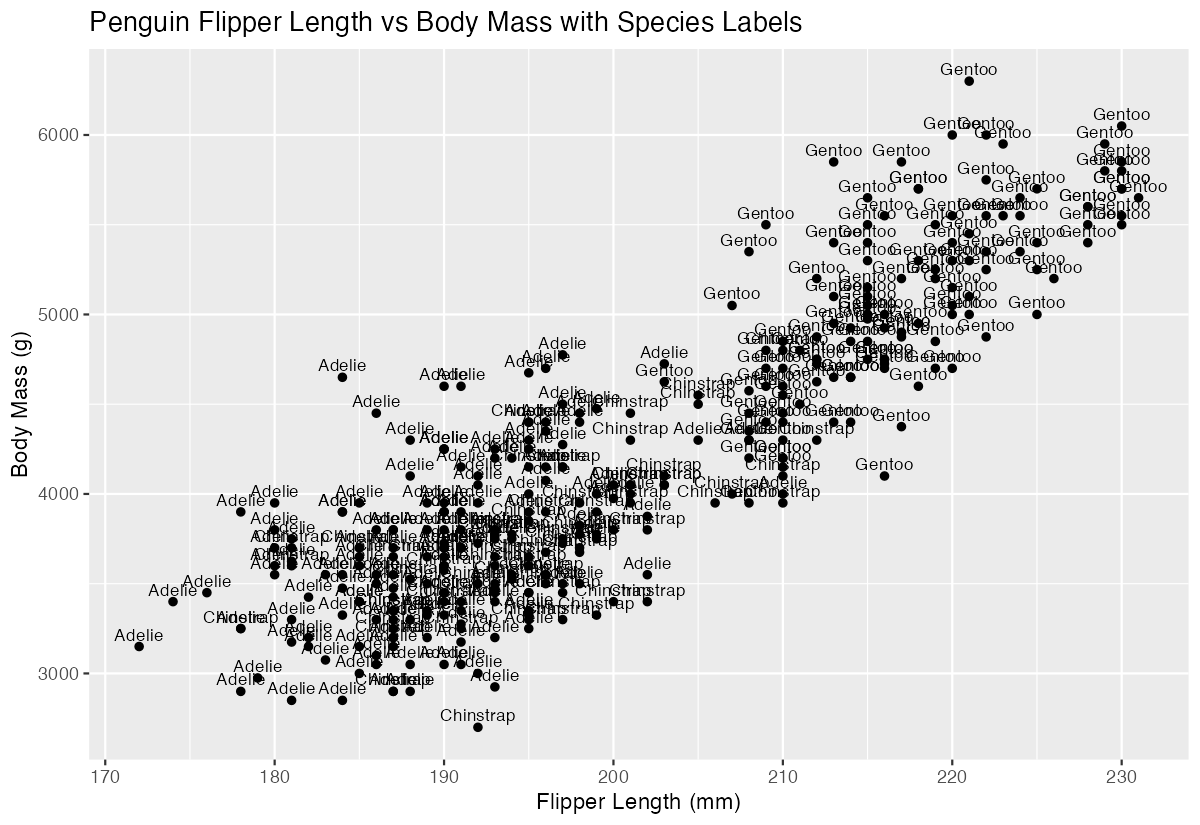
We want to create a scatter plot showing the relationship between penguin body mass and flipper length, with each point labeled by the penguin species.
Step 1: Create the base plot
We’ll start with a simple scatter plot to establish our foundation.
penguins |>
  ggplot(aes(x = flipper_length_mm, y = body_mass_g)) +
  geom_point()
This creates a basic scatter plot with flipper length on the x-axis and body mass on the y-axis.
Step 2: Add text labels
Now we’ll add species labels to each point using geom_text().
penguins |>
  ggplot(aes(x = flipper_length_mm, y = body_mass_g)) +
  geom_point() +
  geom_text(aes(label = species))
Each point now displays the species name, though the text may overlap with the points.
Step 3: Adjust label positioning
We’ll move the labels slightly above the points for better readability.
penguins |>
  ggplot(aes(x = flipper_length_mm, y = body_mass_g)) +
  geom_point() +
  geom_text(aes(label = species), vjust = -0.5)
The vjust = -0.5 parameter moves the text labels above the points, creating cleaner separation.
Example 2: Practical Application
The Problem
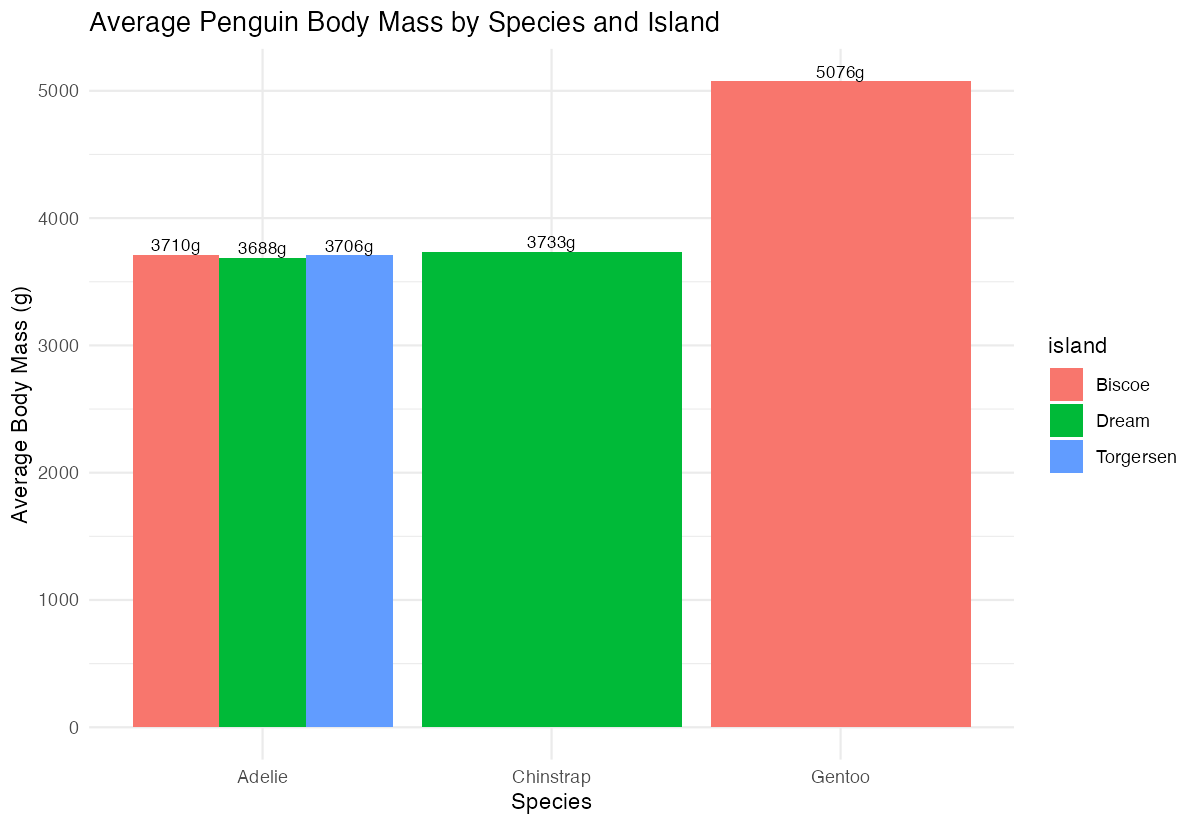
We want to create a summary plot showing the average body mass for each penguin species on each island, with exact values displayed on the bars. This would help stakeholders quickly see both the visual comparison and precise measurements.
Step 1: Prepare the summary data
First, we need to calculate the average body mass by species and island.
penguin_summary <- penguins |>
  group_by(species, island) |>
  summarise(avg_mass = mean(body_mass_g, na.rm = TRUE),
            .groups = "drop")
This creates a summary dataset with average body mass for each species-island combination.
Step 2: Create the bar chart
Now we’ll create a grouped bar chart to visualize the data.
penguin_summary |>
  ggplot(aes(x = species, y = avg_mass, fill = island)) +
  geom_col(position = "dodge") +
  labs(title = "Average Penguin Body Mass by Species and Island")
This produces a grouped bar chart showing average body mass, with different colored bars for each island.
Step 3: Add value labels to bars
We’ll add the exact average values on top of each bar using geom_text().
penguin_summary |>
  ggplot(aes(x = species, y = avg_mass, fill = island)) +
  geom_col(position = "dodge") +
  geom_text(aes(label = round(avg_mass, 0)),
            position = position_dodge(width = 0.9),
            vjust = -0.3)
The position_dodge() ensures labels align with their respective bars, while round() displays clean whole numbers.
Step 4: Improve formatting
Let’s enhance the plot with better formatting and clearer labels.
penguin_summary |>
  ggplot(aes(x = species, y = avg_mass, fill = island)) +
  geom_col(position = "dodge") +
  geom_text(aes(label = paste0(round(avg_mass, 0), "g")),
            position = position_dodge(width = 0.9),
            vjust = -0.3, size = 3) +
  labs(title = "Average Penguin Body Mass by Species and Island",
       y = "Average Body Mass (g)",
       x = "Species") +
  theme_minimal()
Now each label includes “g” for grams, has appropriate sizing, and the overall plot has a clean appearance.
Summary
geom_text()adds text labels to ggplot2 visualizations at specified coordinates- Use the
labelaesthetic to specify which variable contains your text content - Control positioning with
vjust(vertical) andhjust(horizontal) adjustments - For grouped plots, use
position_dodge()to align labels with their corresponding elements Combine
geom_text()with functions likeround()andpaste0()for cleaner label formatting