Simple Barpots and reordering bars in R
Barplots are one of the most effective ways to visualize categorical data and compare values across different groups. They’re particularly useful when you want to show counts, frequencies, or summary statistics in a clear, easy-to-read format.
Getting Started
library(tidyverse)
library(palmerpenguins)
Example 1: Basic Barplot Creation
The Problem
We want to create a simple barplot showing the count of penguins by species. This helps us understand the distribution of different penguin types in our dataset.
Step 1: Examine the Data
Let’s first look at our penguin data to understand what we’re working with.
# Load and examine the penguin data
data(penguins)
head(penguins)
glimpse(penguins)
This shows us the structure of our data, including the species column we’ll use for our barplot.
Step 2: Create a Basic Barplot
We’ll create a simple barplot counting penguins by species.
# Create basic barplot
penguins |>
  ggplot(aes(x = species)) +
  geom_bar() +
  labs(title = "Count of Penguins by Species")
This creates a barplot where each bar represents the count of penguins for each species, automatically calculated by ggplot2.
Step 3: Add Visual Improvements
Let’s enhance our plot with better colors and formatting.
# Improve the barplot appearance
penguins |>
  ggplot(aes(x = species, fill = species)) +
  geom_bar() +
  labs(title = "Penguin Species Distribution",
       x = "Species", y = "Count") +
  theme_minimal()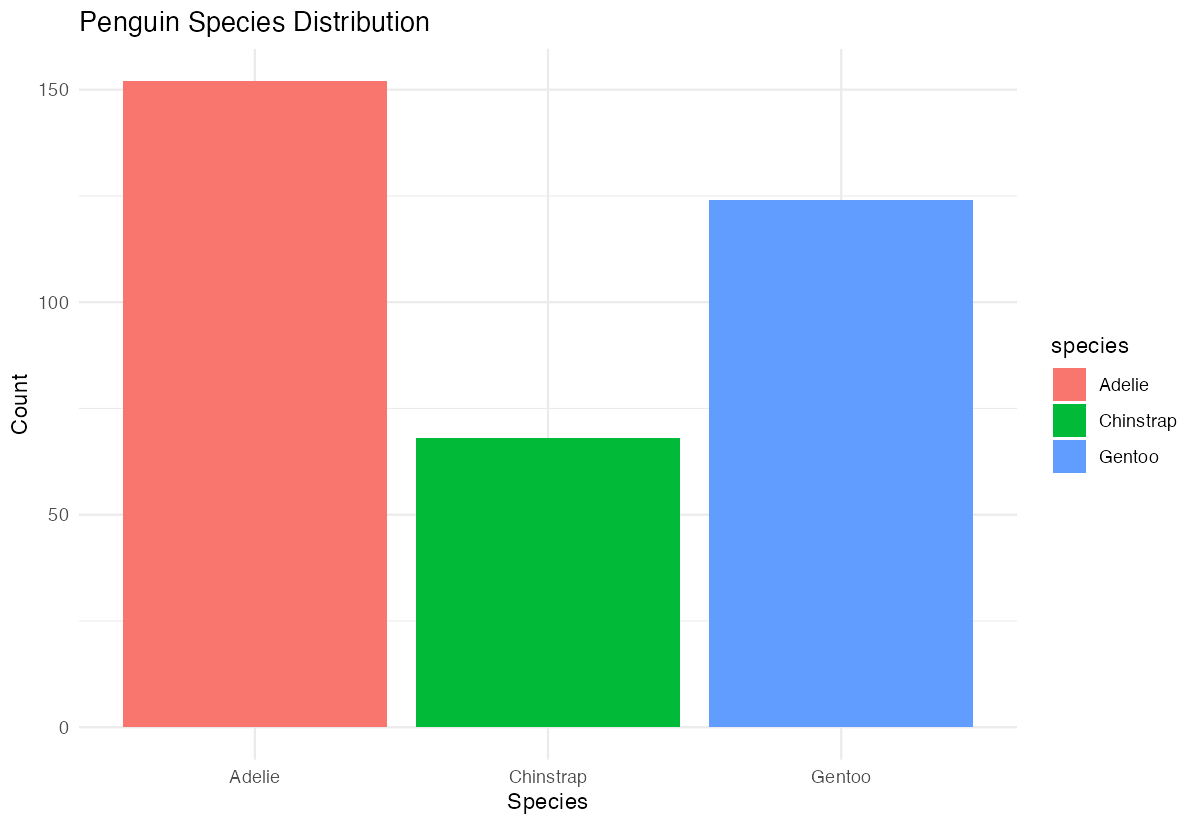
Now our barplot has distinct colors for each species and cleaner formatting with a minimal theme.
Example 2: Reordering Bars for Better Insights
The Problem
Default alphabetical ordering of bars isn’t always the most informative. We want to reorder bars by their values to make patterns more obvious, such as showing species from most to least common.
Step 1: Calculate Summary Statistics
First, we’ll calculate the count for each species so we can reorder them.
# Calculate counts for reordering
penguin_counts <- penguins |>
  count(species) |>
  arrange(desc(n))
print(penguin_counts)
This gives us the exact counts for each species, arranged from highest to lowest.
Step 2: Reorder Bars by Count
Now we’ll create a barplot with bars ordered by frequency using fct_reorder().
# Reorder bars by count (descending)
penguins |>
  ggplot(aes(x = fct_reorder(species, species, length, .desc = TRUE))) +
  geom_bar(fill = "steelblue") +
  labs(title = "Penguins by Species (Ordered by Count)",
       x = "Species", y = "Count")
The bars are now arranged from most to least common species, making the distribution pattern immediately clear.
Step 3: Create Horizontal Barplot
For better readability, especially with longer category names, we can flip the coordinates.
# Create horizontal barplot
penguins |>
  ggplot(aes(y = fct_reorder(species, species, length))) +
  geom_bar(fill = "darkgreen", alpha = 0.7) +
  labs(title = "Penguin Species Distribution (Horizontal)",
       y = "Species", x = "Count") +
  theme_minimal()
Horizontal barplots often provide better readability and are especially useful when category names are long.
Step 4: Advanced Reordering with Summary Statistics
Let’s create a barplot showing average body mass by species, ordered by the values.
# Create barplot of average body mass, ordered by value
penguins |>
  filter(!is.na(body_mass_g)) |>
  group_by(species) |>
  summarise(avg_mass = mean(body_mass_g)) |>
  ggplot(aes(x = reorder(species, avg_mass), y = avg_mass)) +
  geom_col(fill = "coral") +
  labs(title = "Average Body Mass by Species",
       x = "Species", y = "Average Body Mass (g)")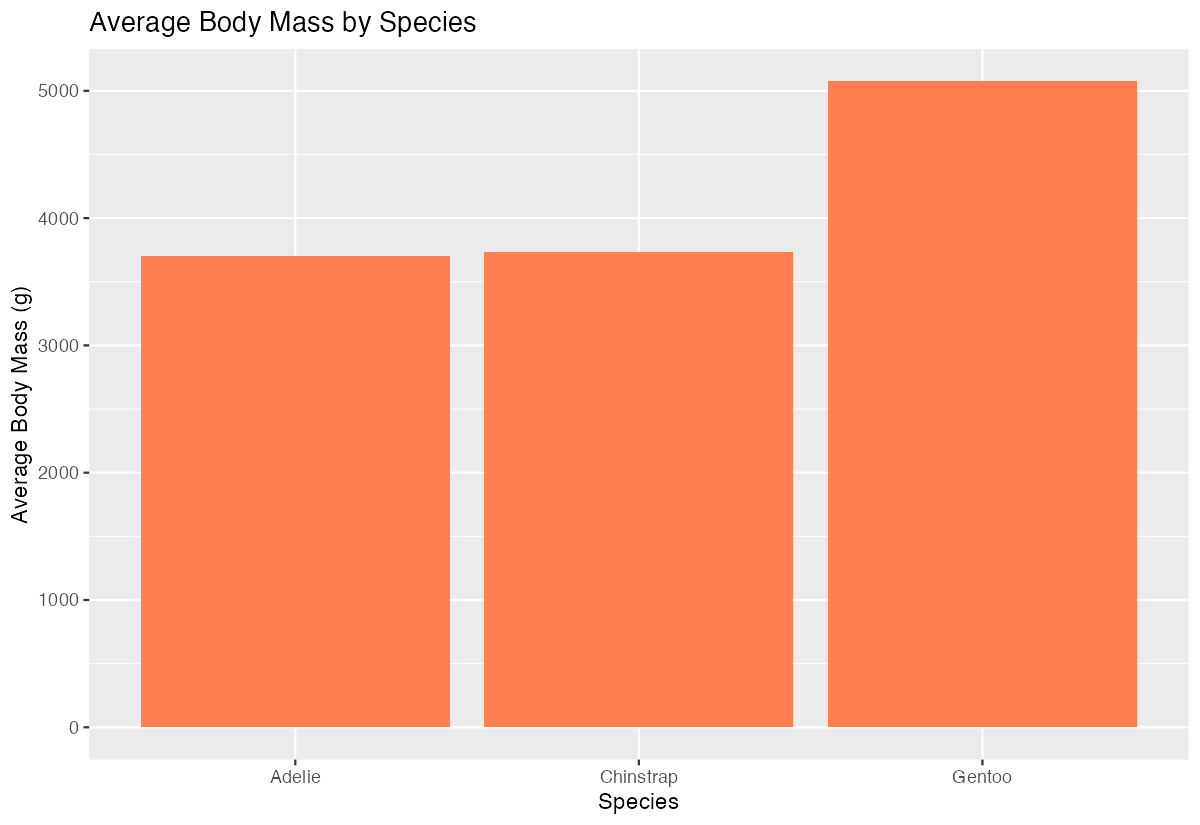
This shows average body mass by species, with bars ordered from lightest to heaviest species on average.
Summary
- Use
geom_bar()for counting occurrences orgeom_col()for plotting pre-calculated values fct_reorder()andreorder()functions help arrange bars by their values rather than alphabetically- Add
.desc = TRUEtofct_reorder()or use negative values inreorder()for descending order - Horizontal barplots (
coord_flip()or using y-axis) improve readability with long category names Always include meaningful titles and axis labels to make your plots self-explanatory