How to use geom_errorbar() in R
Introduction
The geom_errorbar() function in ggplot2 creates error bars that display uncertainty or variability in your data. These visual elements are essential for statistical plots, showing confidence intervals, standard errors, or standard deviations around point estimates.
Getting Started
library(tidyverse)
library(palmerpenguins)
Example 1: Basic Usage
The Problem
We want to create a simple bar chart showing average penguin body mass by species, with error bars representing the standard error of each group.
Step 1: Calculate summary statistics
We need to compute the mean and standard error for each penguin species.
penguin_summary <- penguins |>
  filter(!is.na(body_mass_g)) |>
  group_by(species) |>
  summarise(
    mean_mass = mean(body_mass_g),
    se_mass = sd(body_mass_g) / sqrt(n())
  )
This creates a summary table with mean body mass and standard error for each species.
Step 2: Create the base plot
Now we’ll build a column chart with the calculated means.
base_plot <- penguin_summary |>
  ggplot(aes(x = species, y = mean_mass)) +
  geom_col(fill = "lightblue", alpha = 0.7) +
  labs(title = "Average Penguin Body Mass by Species")
We have a basic bar chart showing mean body mass for each penguin species.
Step 3: Add error bars
Finally, we’ll add error bars using geom_errorbar() to show uncertainty.
base_plot +
  geom_errorbar(
    aes(ymin = mean_mass - se_mass,
        ymax = mean_mass + se_mass),
    width = 0.3, linewidth = 0.8
  ) +
  labs(subtitle = "Error bars show standard error of the mean",
       y = "Mean Body Mass (g)") +
  theme_minimal()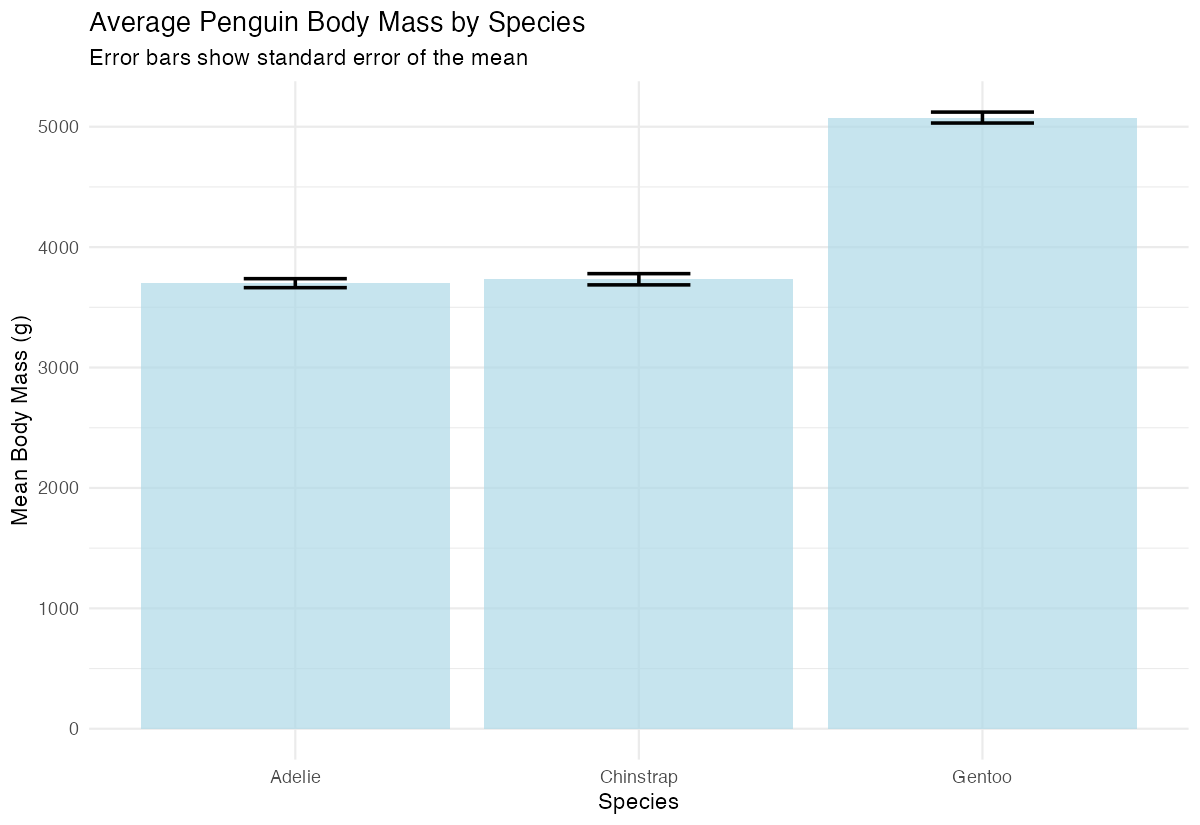
The error bars now display the standard error range above and below each bar, with width controlling how wide the horizontal caps appear.
Example 2: Practical Application
The Problem
We want to compare flipper length across penguin species and islands, showing both the data points and confidence intervals. This represents a real-world scenario where we need to visualize group differences with uncertainty measures.
Step 1: Prepare grouped summary data
Let’s calculate means and standard errors for each species-island combination.
detailed_summary <- penguins |>
  filter(!is.na(flipper_length_mm)) |>
  group_by(species, island) |>
  summarise(
    mean_flipper = mean(flipper_length_mm),
    se_flipper = sd(flipper_length_mm) / sqrt(n()),
    .groups = "drop"
  )
This creates summary statistics grouped by both species and island, giving us multiple categories to compare.
Step 2: Create a point plot with positions
We’ll use geom_point() with position dodging to separate the groups visually.
point_plot <- detailed_summary |>
  ggplot(aes(x = species, y = mean_flipper, color = island)) +
  geom_point(size = 3, position = position_dodge(width = 0.3)) +
  labs(title = "Flipper Length by Species and Island")
The points are now positioned to avoid overlap, with different colors representing different islands.
Step 3: Add styled error bars
We’ll add error bars that match the point positioning and styling.
point_plot +
  geom_errorbar(
    aes(ymin = mean_flipper - se_flipper,
        ymax = mean_flipper + se_flipper),
    width = 0.2,
    position = position_dodge(width = 0.3)
  ) +
  theme_minimal()
The error bars now align perfectly with the points and use the same dodging, creating a clean, professional visualization.
Step 4: Enhance with custom styling
Let’s add final touches to make the plot publication-ready.
point_plot +
  geom_errorbar(
    aes(ymin = mean_flipper - se_flipper,
        ymax = mean_flipper + se_flipper),
    width = 0.2,
    position = position_dodge(width = 0.5),
    linewidth = 0.8
  ) +
  theme_minimal() +
  labs(y = "Flipper Length (mm)", x = "Species",
       subtitle = "Mean ± standard error")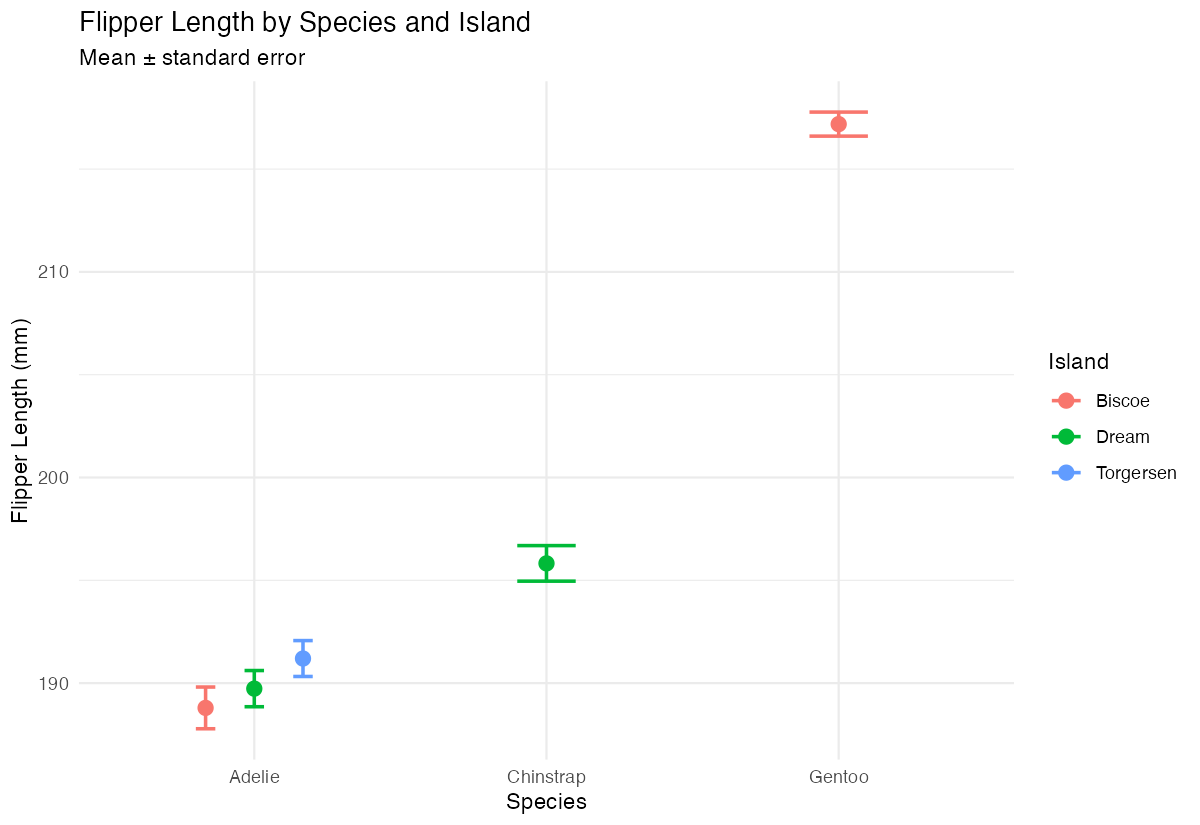
Our final plot combines clear data visualization with appropriate uncertainty representation, suitable for scientific communication.
Summary
geom_errorbar()requiresyminandymaxaesthetics to define error bar endpoints- Use
widthparameter to control the horizontal cap size of error bars
- Combine with
position_dodge()when displaying multiple groups side by side - Calculate standard errors or confidence intervals in your data preparation step
Error bars work well with both
geom_col()andgeom_point()for different visualization styles